Network troubleshooting in the cloud was always a pain. Let’s talk about the Azure Network Watcher and what it can do for you.
Running workloads in the cloud can be very easy but when it comes to troubleshooting something you don’t have access to can prove to be quite a challenge.
As you may know, you’re not dealing with you’re regular on-premises network stack that you’re used to but you’re dealing with software-defined networking or SDN for short. This means that everything is virtualized and you don’t need to managed switches, routers or any other type of networking equipment. In the cloud, you manage virtual networks, subnets, IPs, VPN devices, network rules and so on but on a software level.
While everything is nice and fun with SDN, you will encounter in Azure most of the networking problems that you encounter on-premises. Emphasis on most. You will not deal with hardware problems, VLANs, STP and so on but you will deal with firewall rules, routes, priorities, wrong topologies.
Issues that you might encounter in Azure networking:
Loss of network connection
VM cannot connect to a service
VPN Gateway is not connecting to the on-premises server
VMs across VNET Peering cannot connect
Everything is wrong; Nothing works ?
Sounds familiar? It’s mostly the same as on-premises but you’re dealing with a different technology stack.
What are my options?
In Azure, there’s a nice piece of free technology called Network Watcher which allows you to do network debugging and figure out most of the time, where the network problem is. When I say most of the time, I’m saying that there are those cases where you do everything in your power and still cannot figure out where’s the issue.
Enabling Network Watcher:
This is the easy part; Go to All Services in Azure and type in Network Watcher then in the overview blade select the region where it should be enabled.
Network Watcher capabilities
With Network Watcher you have the following capabilities:
Network Topology
Connection Monitor
Network Performance Monitor
IP Flow verification
Next Hop validation
Effective NSG rules
VPN Troubleshooting
Packet Capturing
Connection Troubleshooting
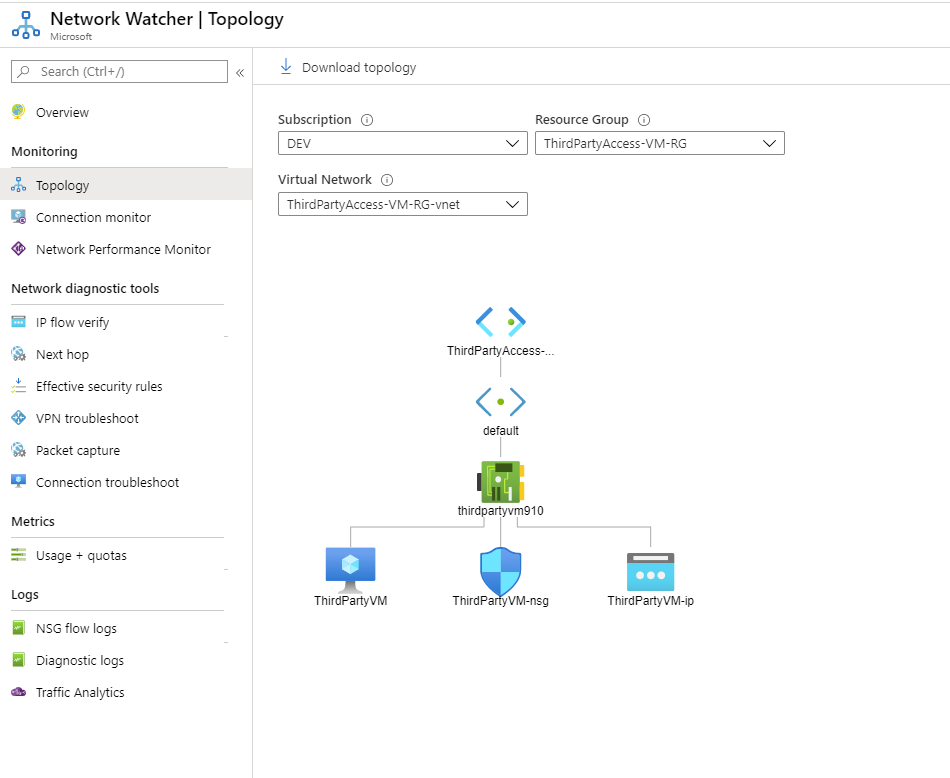
Network Topology:
Network topology gives you a network diagram of actual Virtual network in scope. You select the subscription, RG and Virtual Network where you require the diagram and you get a network topology of what’s connected and how it’s connected.
This allows you to visually map how you’re network is deployed in Azure which means that you and obviously it helps when somebody requests a very detailed network diagram.
Connection Monitor:
Connection monitor allows you to set up a continuous endpoint monitor which gives you metrics about the connections over a period of time.
To set up a connection monitor, you need to press on Add and then specify what you need to monitor.
If you’re selecting an Azure VM as the source then the AzureNetworkWatcheExtesion will be installed to that VM. One thing to watch out when you’re specifying an Azure VM in the source pane is that you will be able only to select Azure VMs that are part of the same VNET. Not a peered network or anything else. The workaround to this problem would be to just specify an IP address and that’s it.
Once you start the connection monitor, you will get prompted with some historical data in graph and data from connection metrics and status. In the example from above, you can see that I set up a connection monitor from the Azure VM to 8.8.8.8 and you can see that the VM can communicate with Google DNS and the return time is 2 MS (1MS round-trip). If I would have had a problem I would have known when the problem happened and validate in the Azure Monitor logs what happened.
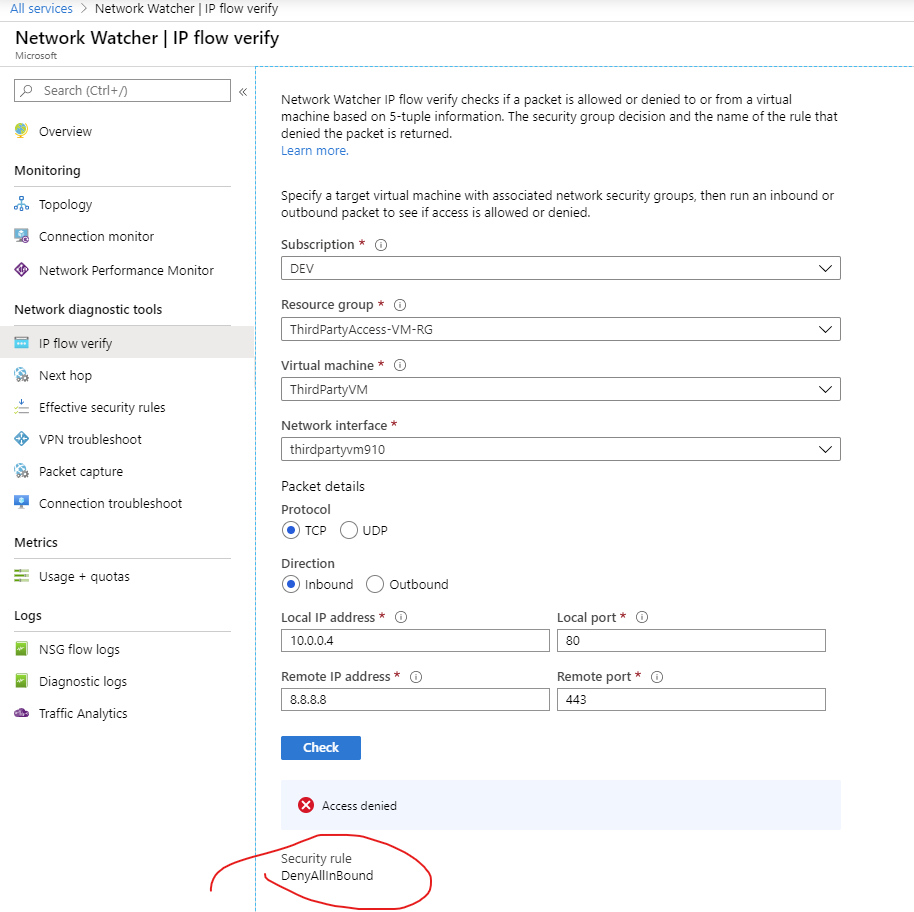
IP Flow Verify
IP Flow Verify lets you validate the configuration of your Network Security Group rules; It requires you to input five packet details (Protocol, Direction, SourceIP, SourcePort, DestinationIP and DestinationPort)
Once provided, Network Watcher|IP Flow Verify will do an NSG check to validate if the connection succeeds or fails. This basically validates your NSG configuration and not your VM firewall. If it succeeds or fails it’s going to tell you which rule was hit.
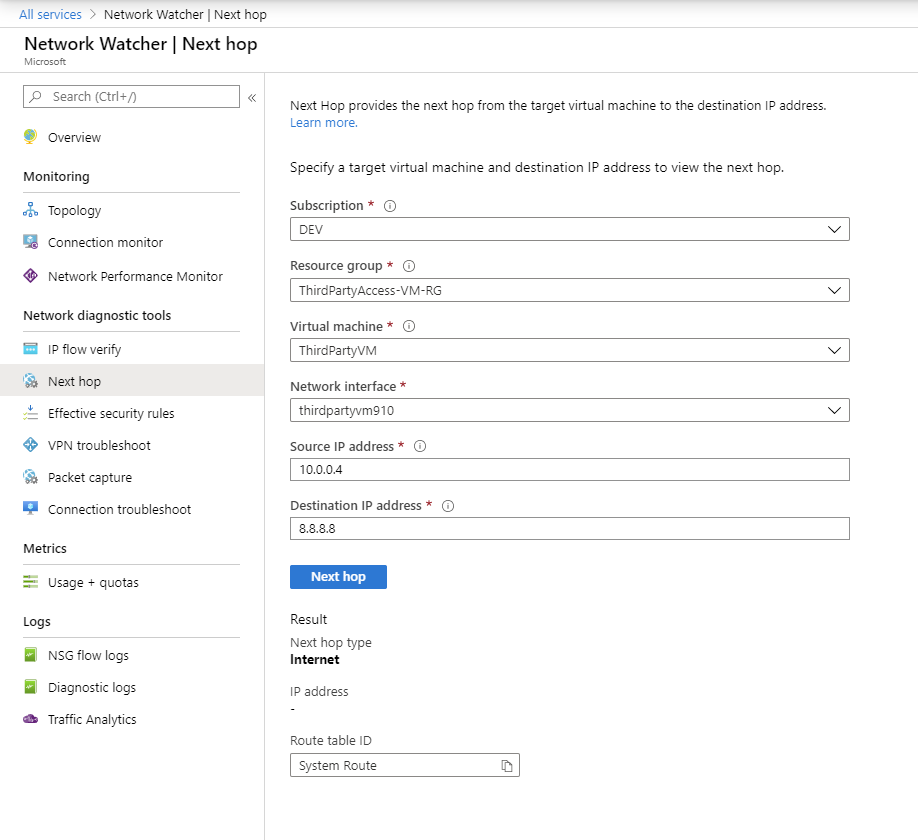
Next Hop
Next Hop is one of the simplest tools available in Network Watcher; It’s basically a tool that tells you which where the packet will go. It also gives you which route table is affecting the packet route.
Some examples of Next Hop are: VNET Peer, Internet, VNET or Network Appliance (NGFW)
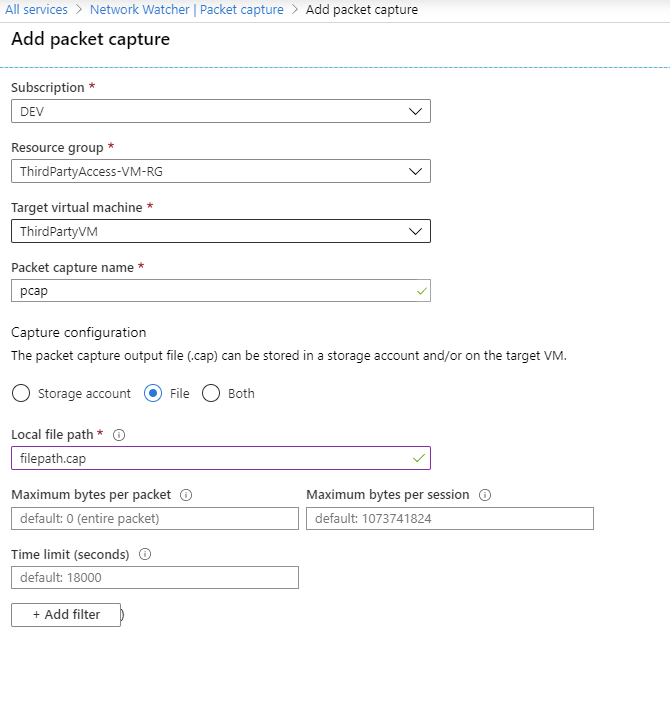
Packet Capture
Packet Capture or Network Capture is the be all end all of the network troubleshooting. This tool allows you to very detailed captures of what’s happening on a target VM.
Before diving into this tool, it’s recommended to have a storage account ready for the captures because it’s much fast to get and distribute the data that’s being monitored. Otherwise, you have the option of saving the file locally on the VM but you’re not so flexible at that point.
When you’re specifying the details for the packet capture, you have the possibility of filtering out irrelevant traffic as shown in the picture above.
What about the others?
This article wants to show getting the basics of network monitoring in Azure. There’s Network Performance Monitor which is a whole beast itself and requires a hefty deployment to show off the possibilities. VPN Troubleshoot which gives you a log of what’s happening so you can debug VPN settings (on-premises ones mostly) and the logging part which will be another article as the scope is different there.
That being said. Thanks for reading and have a good one!
Platform guardrails prevent damage but often turn into friction machines. How to design guardrails that actually prevent bad patterns, layer detection and correction, and build platforms developers trust.
APIM isn't just a gateway. It's a governance layer that enforces consistency across AKS, Container Apps, and other platforms. When to use it and when to keep things simple.
If you're still deploying to Azure from GitHub Actions with static credentials in 2026, you have better options. Here's how to eliminate credentials from GitHub entirely using OIDC and workload identity, and why it matters.


