A couple of years ago, I had contact with Prometheus and Grafana; it was 2017 when I deployed my first production ACS (Azure Container Service) cluster, and the funny fact was that it also used GPUs. I even wrote a blog post about it a year later when ACS was rebranded as AKS and this blog was running on WordPress.
What did I know about Kubernetes at that point? Not as much as I know now, and I still don't know everything about it. Back to the story, the cluster was deployed to accommodate an application on two virtual machines running Docker and exposed with an Azure Application Gateway. The app was not ready for production then but had to be ready in 1-2 months. The setup wasn't horrible; however, the app wasn't working on the internet. While privately, it worked fine but it couldn't be accessed from the internet via that ALB. The problem I found was that the app was working fine; however, when probed, it returned 404 not found, and obviously, the probes said that the application was not available. At that point, I had the most stupid idea: to create a custom probe that would consider the endpoint healthy if it returned 404 not found, which worked perfectly. That couldn't go into production, but it worked, right?
Anyway, at that point, I was doing ACS demos, talking about ACS, and dreaming of ACS as the go-to solution for everything. I know, I know. I was young, OK?
So, I put my money where my mouth was and proposed doing a proof of concept showing the orchestration power of Kubernetes and how this application would be able to scale to the moon with enough money. So, obviously, I sold the idea, and now I had to deliver, which took me two days to get right as I've had all the test and demo scripts required to get it running.
To cut it short, I delivered, and everybody said cool; now we need it to be production grade, metrics, graphs, and all the bells and whistles. I said, sure, it has metrics and graphs because I installed Prometheus and Grafana in advance, but I never took the time to play with them in more depth to know the capabilities. The fun part was that my assumptions were correct: you could monitor GPU usage and get those metrics visible, but boy, I had a day getting them to show up. Anyway, getting those things to show up was my first crash course in Prometheus and Grafana, but I learned a lot and saw the value of these two applications.
The bad part was they were self-hosted, finicky to manage, and easy to break, which made me wish for a more managed solution which could be centralized and not have things like Thanos installed.
Why I Started Using Azure's Managed Monitoring Services
I spent too much time maintaining Prometheus and Grafana in my Kubernetes clusters. Storage issues, high availability concerns, upgrades, scaling problems, data loss - you name it, I've dealt with it.
Monitoring should give you insights without becoming a full-time job itself. The moment they became available in public preview, I was so relieved and happy that the light at the end of the tunnel started showing.
The beauty of these managed services is that they let you focus on what matters—getting valuable insights from your metrics—rather than worrying about the infrastructure behind them. You shouldn't worry about the infrastructure behind them; let that be someone else's problem.
Understanding Azure Monitor Managed Service for Prometheus
Azure Monitor Managed Service for Prometheus is a fully managed environment for running Prometheus, integrated directly into Azure Monitor. The service's main design is to make managing and scaling Prometheus easier, with ease of deployment in Azure Kubernetes clusters.
The service offers the following benefits:
Automatic deployment and management - No need to manually deploy and configure Prometheus components
High availability and SLA guarantees - Microsoft handles the availability aspects
Automatic software updates - Always running the latest stable version without manual intervention
Scalable metrics storage with up to 18 months retention - No more worrying about disk space
Native integration with Azure Monitor - Works seamlessly with other Azure monitoring tools
Prometheus metrics are stored in an Azure Monitor workspace, which means you can benefit from Azure's infrastructure while using PromQL for querying and analysis.
Azure Managed Grafana is the same Grafana you know and love, delivered as a fully managed Azure service. It combines metrics, logs, and traces into a single interface, enabling thorough visibility into your applications and infrastructure.
The service offers several Azure-specific enhancements:
Built-in support for Azure Monitor and Azure Data Explorer - Seamless integration with existing Azure services
User authentication and access control using Microsoft Entra ID - Simplified identity management
Direct import of existing charts from the Azure portal - Easily migrate existing visualizations
High availability with zone redundancy in supported regions - Enterprise-grade reliability
What I particularly value about Azure Managed Grafana is that it eliminates the need to deal with setup, configuration, and maintenance tasks. This means that you can focus on creating visualizations rather than managing the underlying platform.
Before diving into the hands-on part, let's understand how these components work together:
Azure Monitor Workspace serves as the central repository for all Prometheus metrics
Azure Monitor Agent (deployed automatically to AKS clusters) collects metrics and sends them to the workspace
Azure Managed Grafana connects to the Azure Monitor Workspace using its query endpoint
Authentication is handled via Managed Identity or Microsoft Entra ID
The beauty of this architecture is its simplicity. Microsoft has abstracted much complexity while maintaining compatibility with open-source tooling. Your knowledge of PromQL and Grafana dashboards still applies, but you don't have to worry about the underlying infrastructure.
Getting started
Now, let's get our hands dirty with a complete setup. I will walk through each step of configuring and connecting both services to monitor an AKS cluster.
Create an Azure Monitor Workspace
First, we need to create the foundation - an Azure Monitor workspace that will store our Prometheus metrics:
# Set variables for convenience
RESOURCE_GROUP="prometheus-demo-rg"
LOCATION="westeurope"
WORKSPACE_NAME="prometheus-workspace"

# Create resource group if you don't have one already
az group create --name $RESOURCE_GROUP --location $LOCATION

# Create Azure Monitor workspace
az monitor account create \
  --name $WORKSPACE_NAME \
  --resource-group $RESOURCE_GROUP \
  --location $LOCATION
This workspace serves as the central repository for all your Prometheus metrics and provides the query endpoint that Grafana will use.
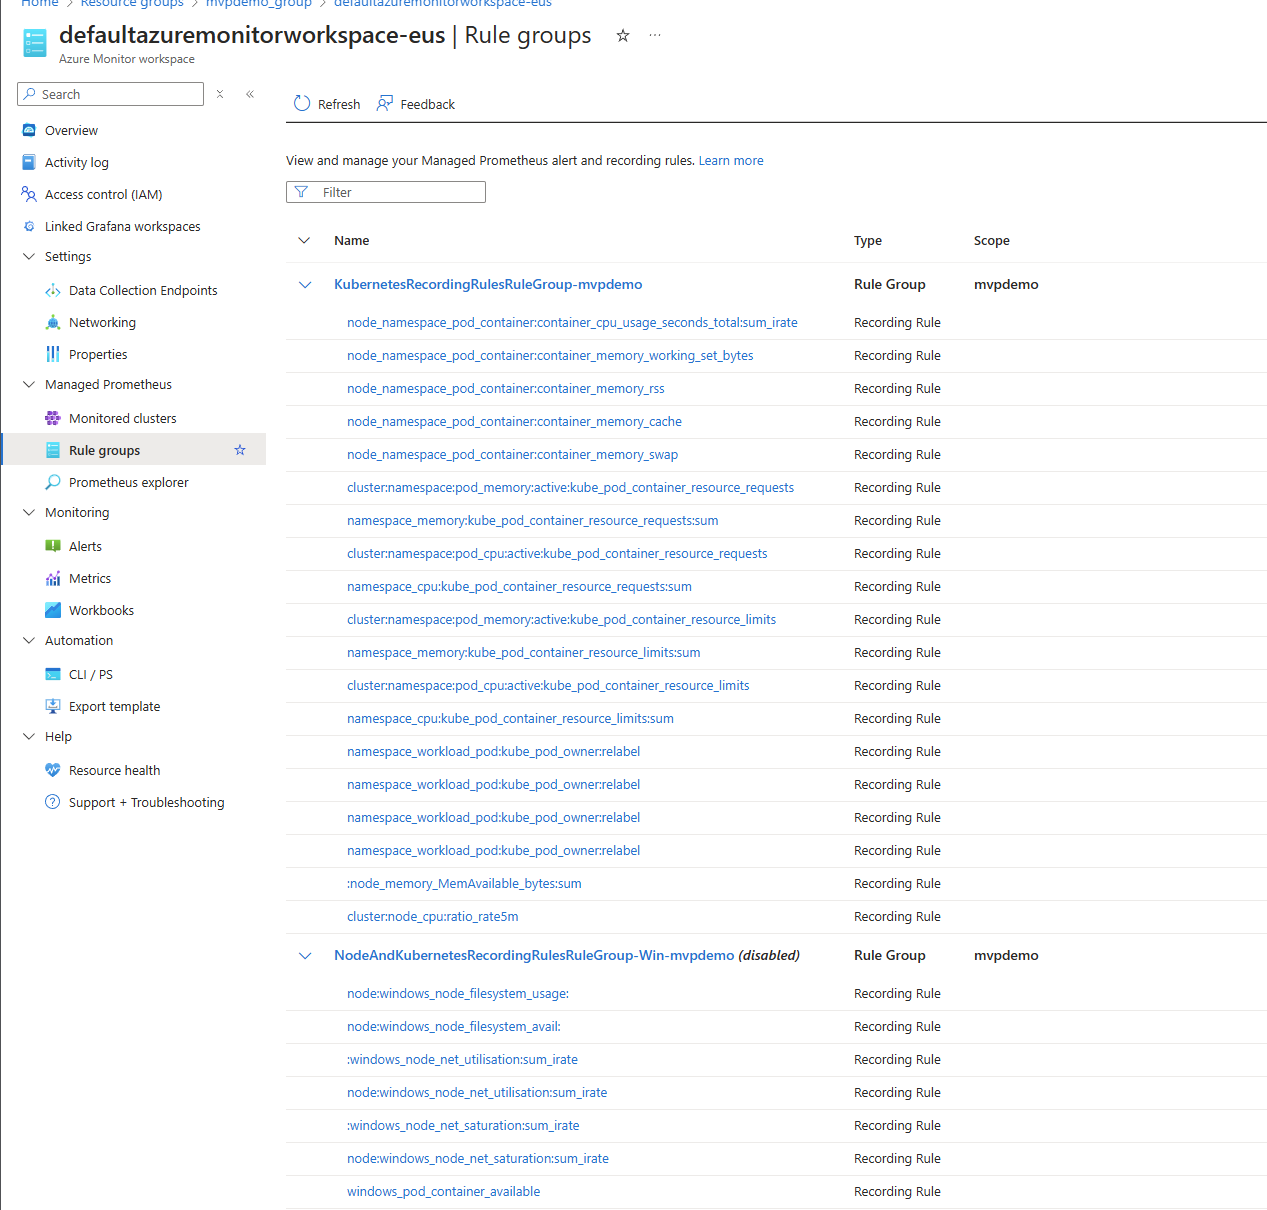
Navigate to your resource group to see the new Azure Monitor workspace. The Overview page of this workspace contains important information, including the query endpoint that we'll need later when configuring Grafana.
Enable Prometheus Metrics Collection in AKS
Now, let's configure our AKS cluster to send Prometheus metrics to the Azure Monitor workspace:
# Set AKS cluster name (assuming you already have a cluster)
AKS_CLUSTER_NAME="my-aks-cluster"

# Enable Azure Monitor metrics add-on
az aks update \
  --resource-group $RESOURCE_GROUP \
  --name $AKS_CLUSTER_NAME \
  --enable-azure-monitor-metrics \
  --azure-monitor-workspace-resource-id $(az monitor account show --name $WORKSPACE_NAME --resource-group $RESOURCE_GROUP --query id -o tsv)
This command enables the Azure Monitor Metrics add-on, automatically deploying a special version of the Azure Monitor Agent (AMA) to your cluster. The agent collects Prometheus metrics from your AKS cluster and forwards them to your Azure Monitor workspace.
The beauty of this approach is that you don't need to deploy and configure Prometheus components manually —the add-on handles everything for you. It automatically sets up the necessary scraping configurations and exporters to collect metrics from your cluster and workloads.
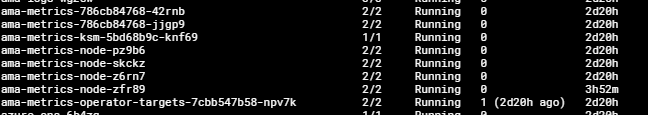
If you want to verify that the metrics collection is working, you can check the agent pods that were deployed:
kubectl get pods -n kube-system | grep ama-metrics
You should see several pods running the Azure Monitor Agent.
Create an Azure Managed Grafana Workspace
With metrics being collected, we need a way to visualize them. Let's create an Azure Managed Grafana workspace:
# Set Grafana workspace name
GRAFANA_NAME="my-grafana-workspace"

# Create Azure Managed Grafana workspace
az grafana create \
  --name $GRAFANA_NAME \
  --resource-group $RESOURCE_GROUP \
  --location $LOCATION \
  --sku Standard
This command creates a Standard tier Grafana workspace, which provides high availability and support for enterprise features. The deployment might take a few minutes to complete.
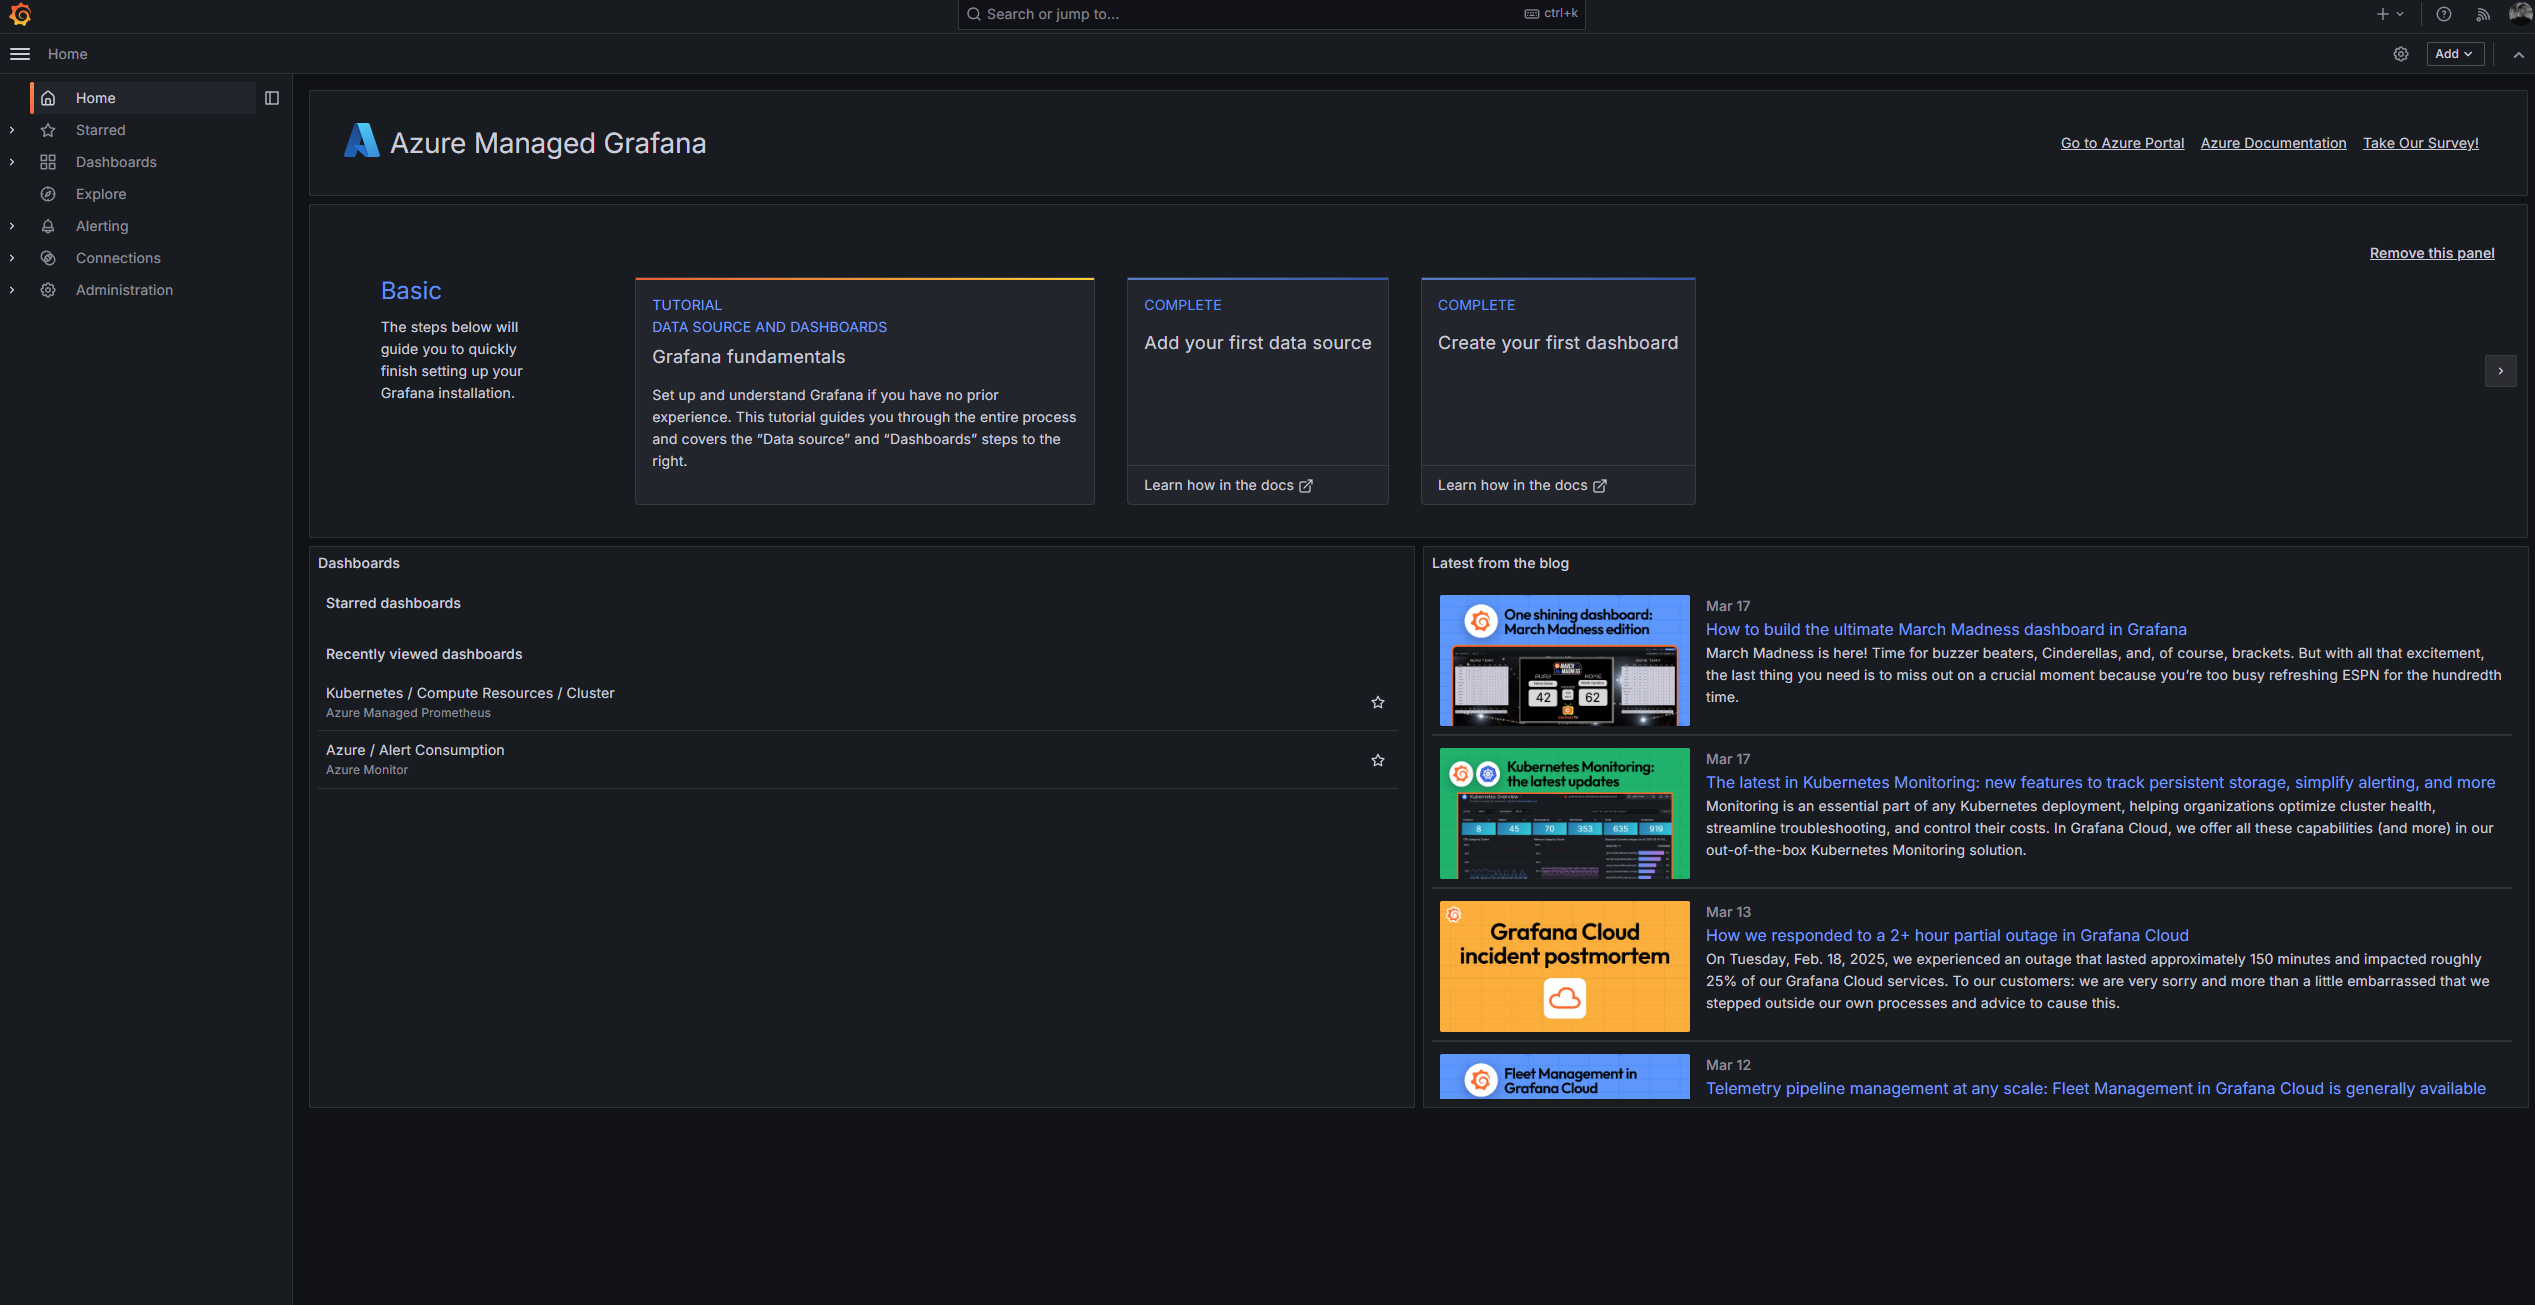
After completion, you can find your Grafana workspace in the Azure portal. The Overview page shows you the endpoint URL you'll use to access Grafana and guess what, its Entra ID enabled which means that we get Entra ID Security passed on to Grafana. Awesome!
Configure Access Control for Grafana
To manage access to your Grafana workspace, you'll need to assign appropriate roles:
# Assign Grafana Admin role to yourself
az role assignment create \
  --assignee $(az ad signed-in-user show --query id -o tsv) \
  --role "Grafana Admin" \
  --scope $(az grafana show --name $GRAFANA_NAME --resource-group $RESOURCE_GROUP --query id -o tsv)
As I mentioned above, Azure Managed Grafana uses Microsoft Entra ID for identity management, allowing you to control access at a granular level. The command above assigns you the Grafana Admin role, which gives you full access to create and manage dashboards, data sources, and other Grafana resources.
You can also assign other roles, such as Grafana Editor or Grafana Viewer, to other users or groups in your organization:
# Example: Assign Grafana Editor role to another user
USER_OBJECT_ID="<user-or-group-object-id>"

az role assignment create \
  --assignee $USER_OBJECT_ID \
  --role "Grafana Editor" \
  --scope $(az grafana show --name $GRAFANA_NAME --resource-group $RESOURCE_GROUP --query id -o tsv)
These role assignments determine what users can do within Grafana, following the principle of least privilege.
Enable Managed Identity for Azure Monitor Access
To allow Grafana to read metrics from your Azure Monitor workspace, we need to enable a managed identity and grant it appropriate permissions:
# Enable system-assigned managed identity for Grafana
az grafana update \
  --name $GRAFANA_NAME \
  --resource-group $RESOURCE_GROUP \
  --identity-type SystemAssigned

# Assign Monitoring Data Reader role to the managed identity
az role assignment create \
  --assignee $(az grafana show --name $GRAFANA_NAME --resource-group $RESOURCE_GROUP --query identity.principalId -o tsv) \
  --role "Monitoring Data Reader" \
  --scope $(az monitor account show --name $WORKSPACE_NAME --resource-group $RESOURCE_GROUP --query id -o tsv)
This managed identity simplifies authentication between Grafana and Azure Monitor, eliminating the need for credentials management. The first command enables the system-assigned managed identity for your Grafana workspace, and the second command assigns it the Monitoring Data Reader role on your Azure Monitor workspace.
This role allows Grafana to read metrics data from the workspace but doesn't grant any right or management permissions, following the principle of least privilege.
Connect Grafana to Azure Monitor Workspace
Now, let's connect Grafana to our Azure Monitor workspace to visualize Prometheus metrics:
Open your Azure Managed Grafana workspace in the Azure portal
Click on the "Endpoint" URL to access the Grafana UI
Navigate to "Connections" → "Data sources"
Click "Add data source"
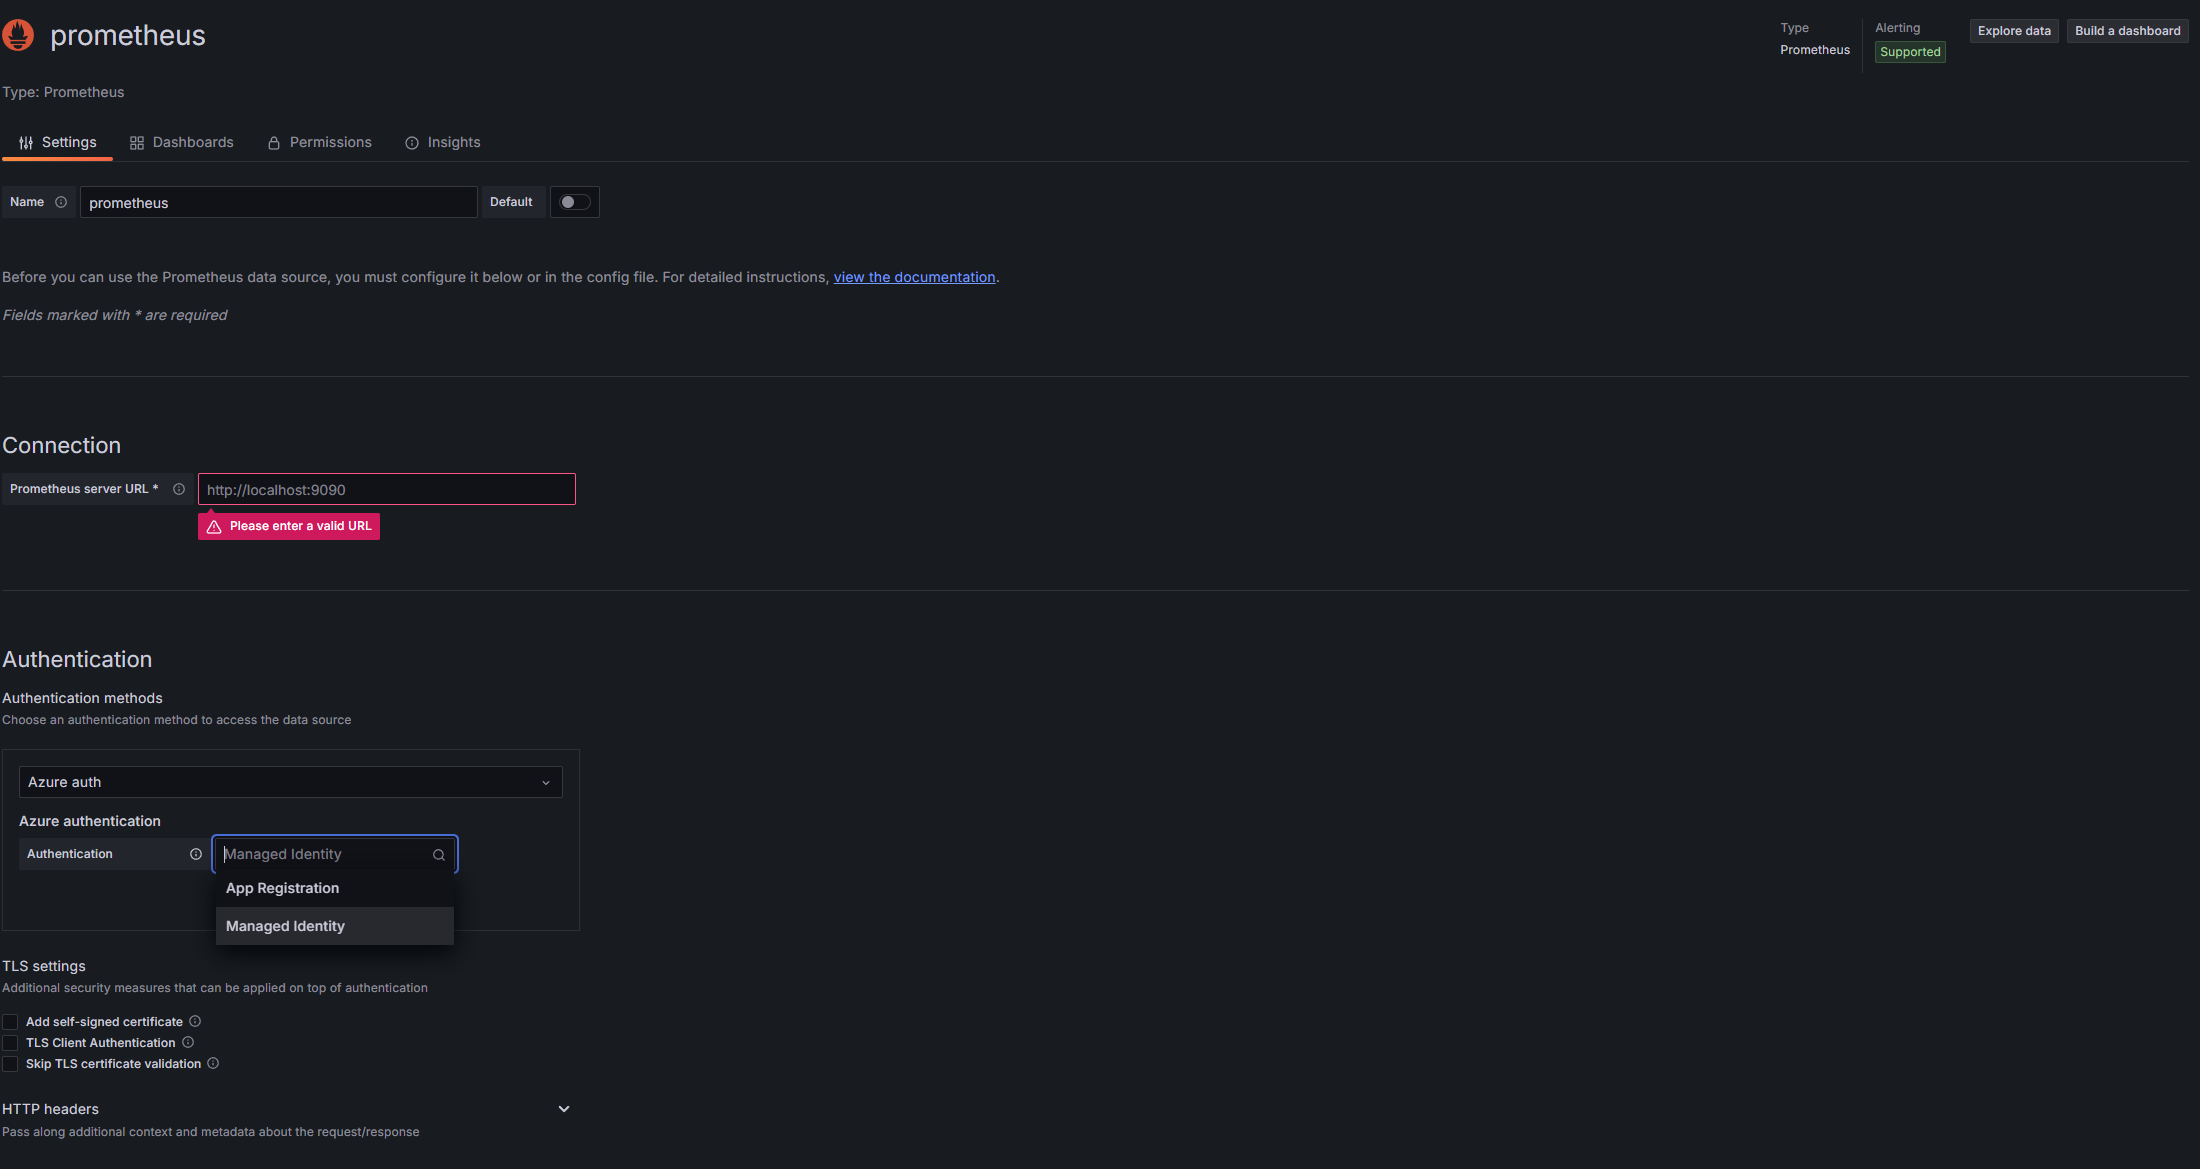
Search for and select "Prometheus"
For the Prometheus server URL, use the query endpoint from your Azure Monitor workspace (found in the Overview page)
Under authentication, select "Azure Auth"
For Azure Authentication, select "Managed Identity" from the dropdown
Click "Save & test" to verify the connection
If everything is configured correctly, you should see a success message. This confirms that Grafana can connect to your Azure Monitor workspace and query Prometheus metrics.
The configuration uses the managed identity we set up earlier, so there's no need to manage credentials or API keys.
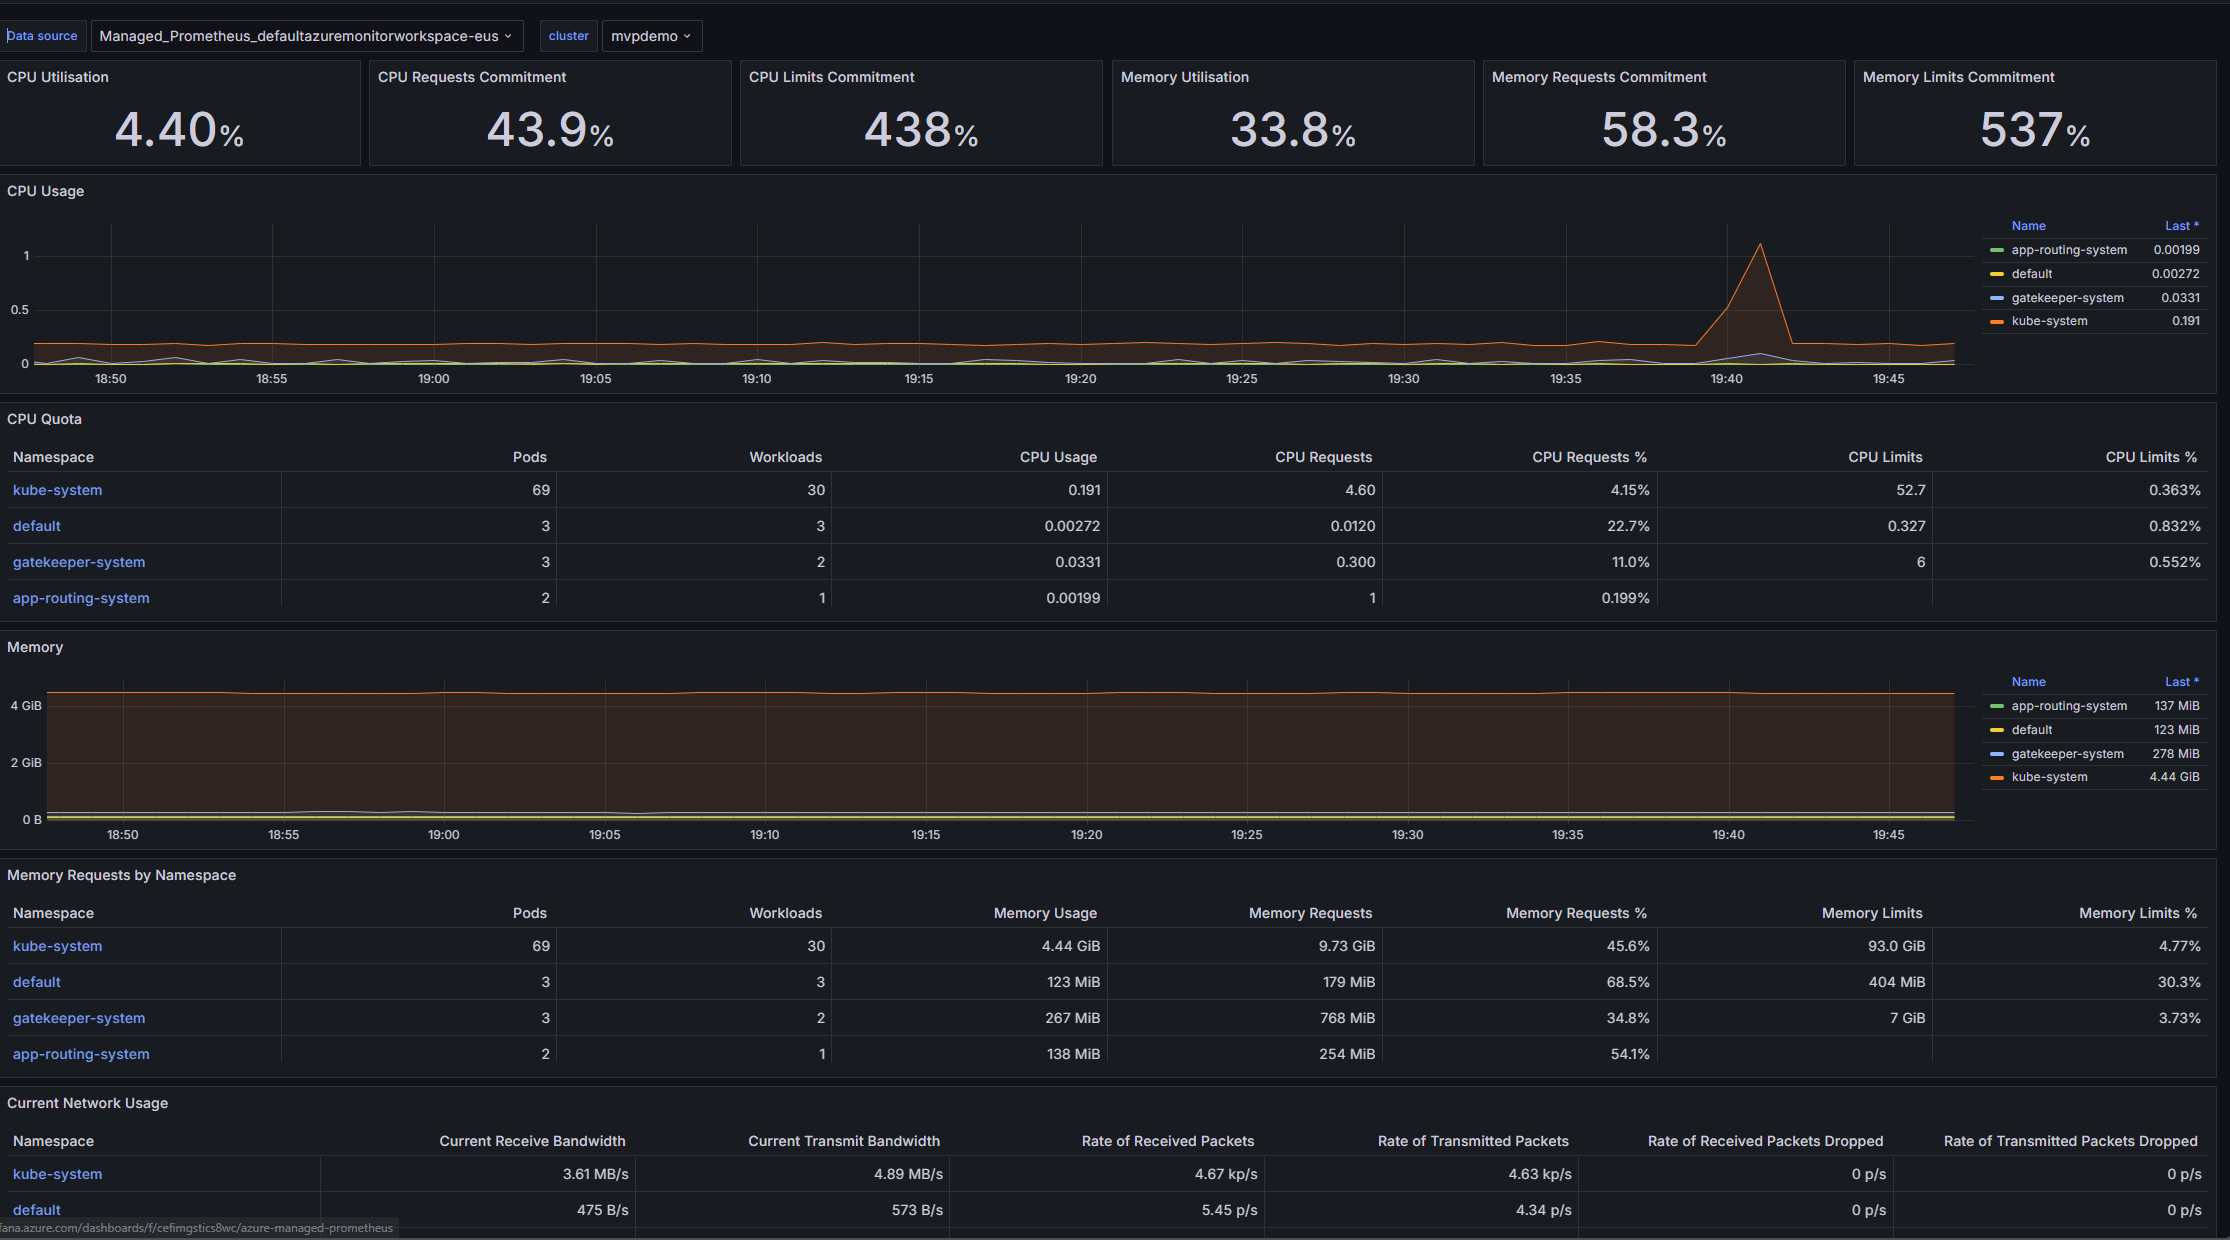
Creating Effective Dashboards in Azure Managed Grafana
With everything connected, it's time to create dashboards to visualize your metrics. You have several options:
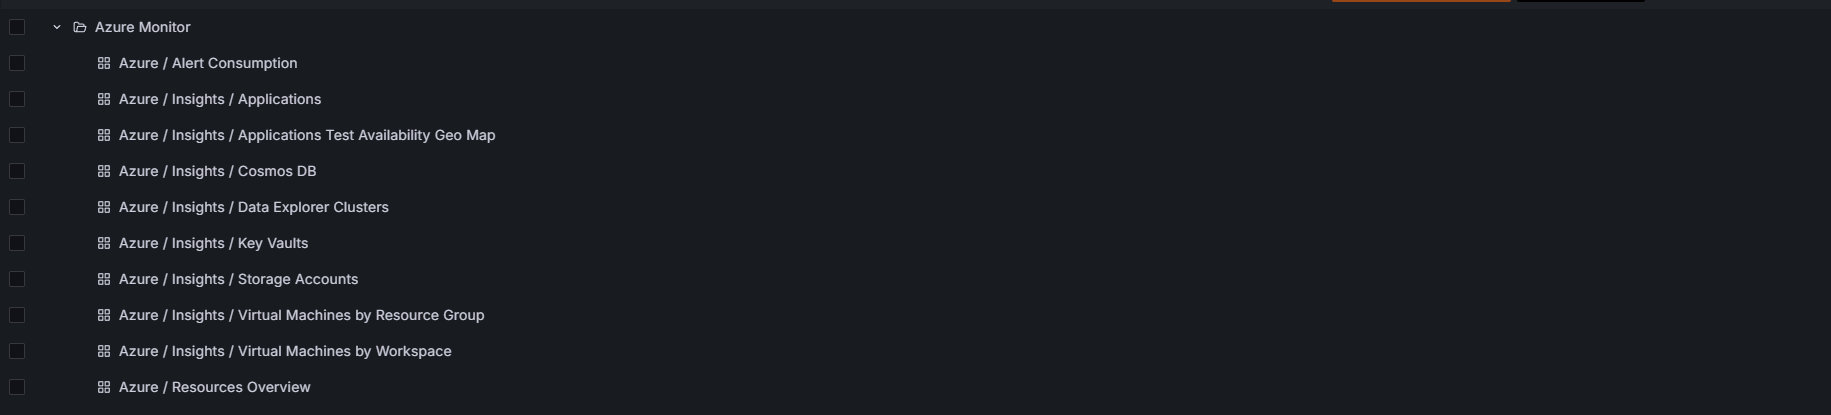
Import Existing Dashboards
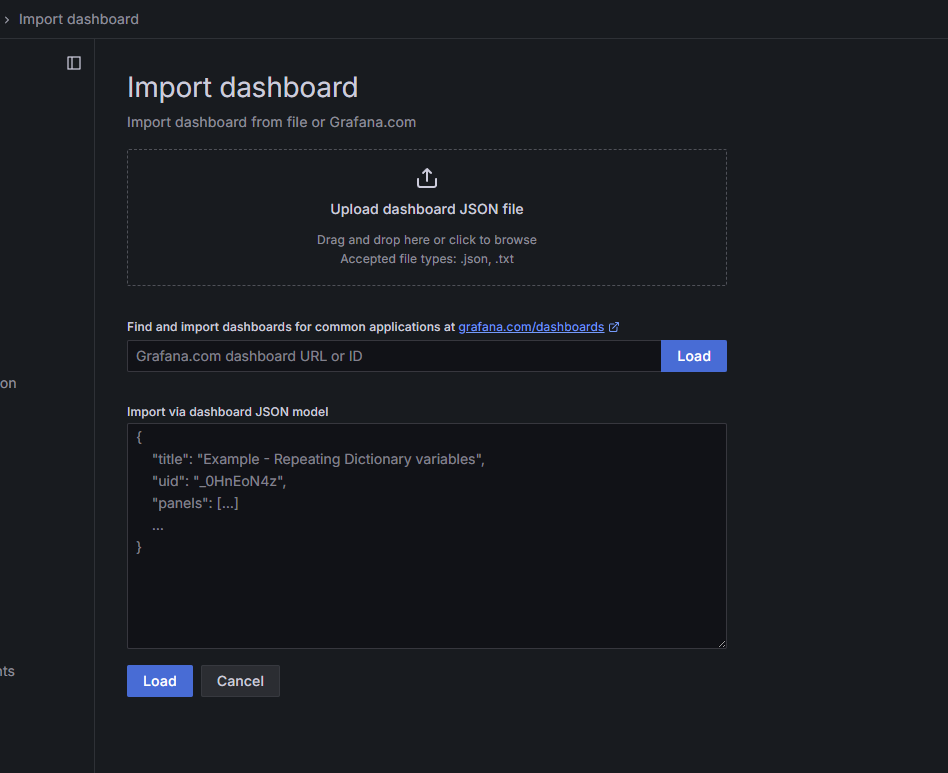
One of the quickest ways to get started is to import pre-built dashboards from the Grafana community:
In Grafana, go to "Dashboards" → "Import"
Enter a dashboard ID (e.g., 10000 for the Node Exporter dashboard)
Click "Load"
Select your Prometheus data source
Click "Import"
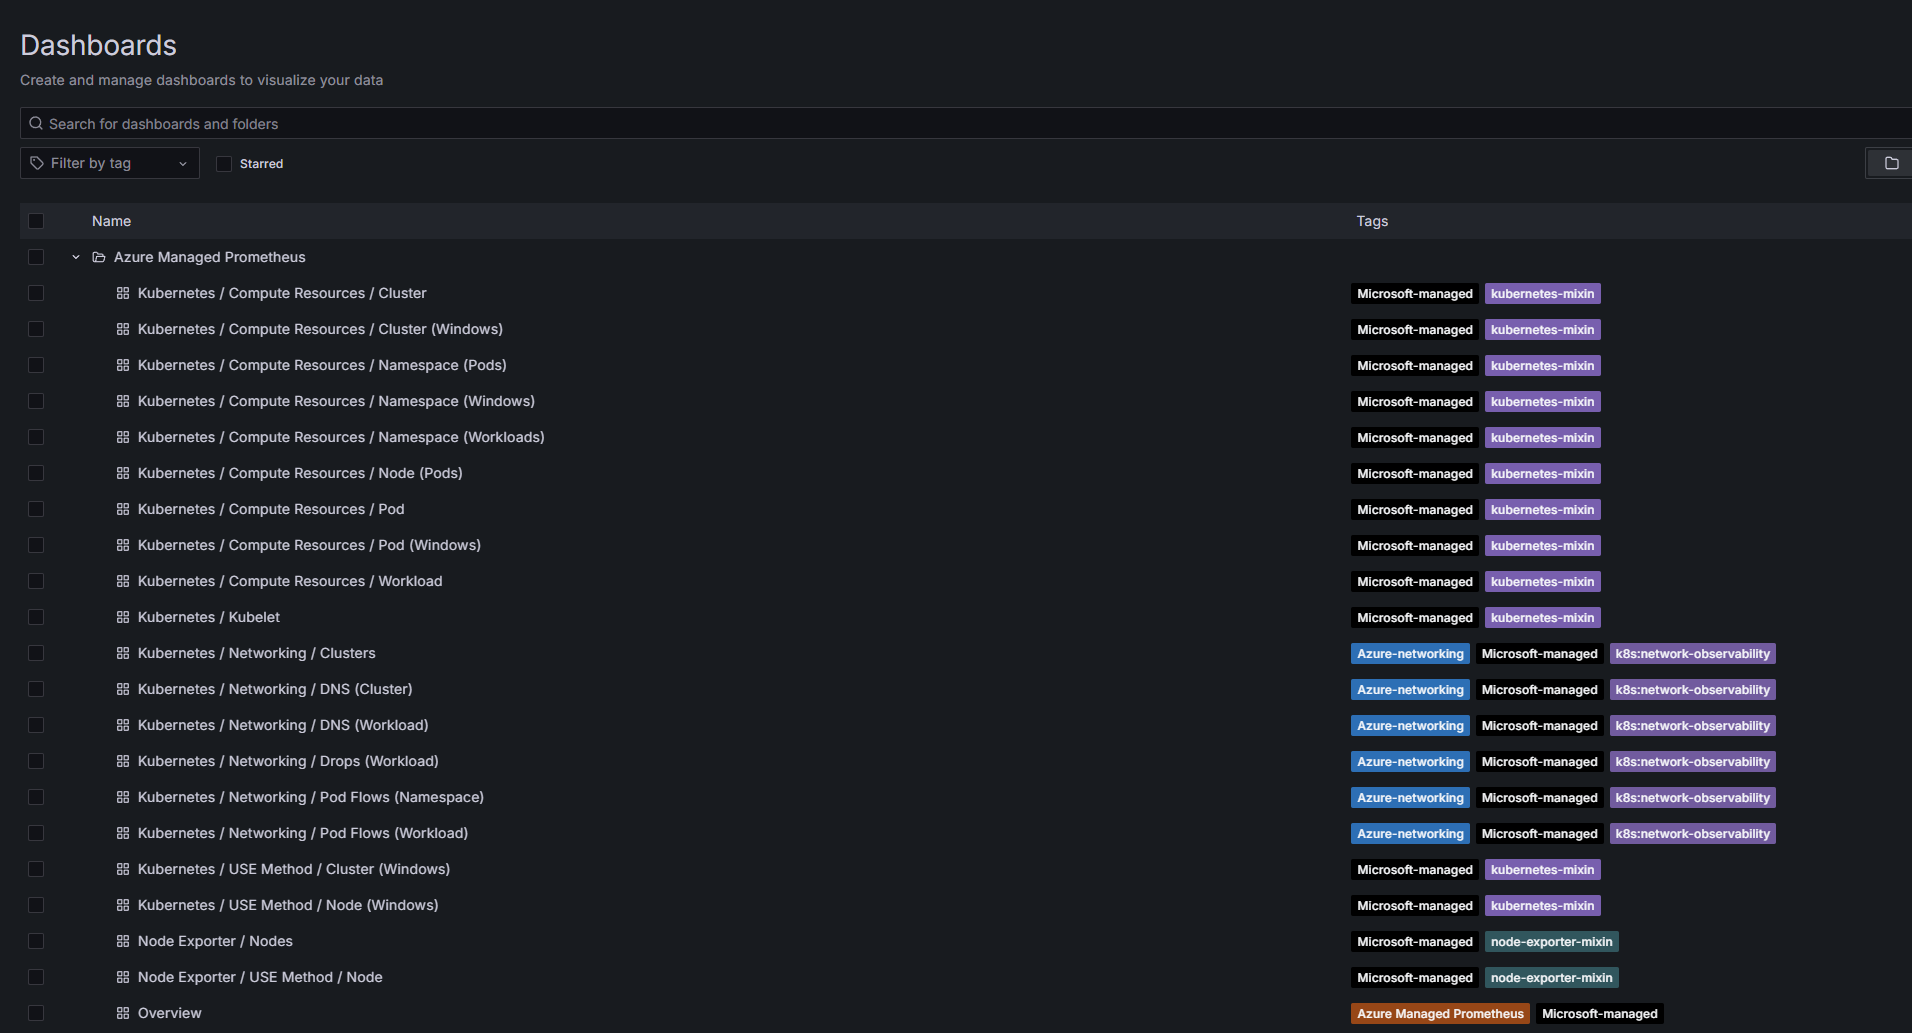
Grafana has a vast library of pre-built dashboards for various applications and services. You can find dashboard IDs on grafana.com/dashboards. For AKS monitoring, you might want to look for dashboards related to Kubernetes, kube-state-metrics, and Node Exporter.
Each dashboard can be customized after importing to better suit your specific requirements.
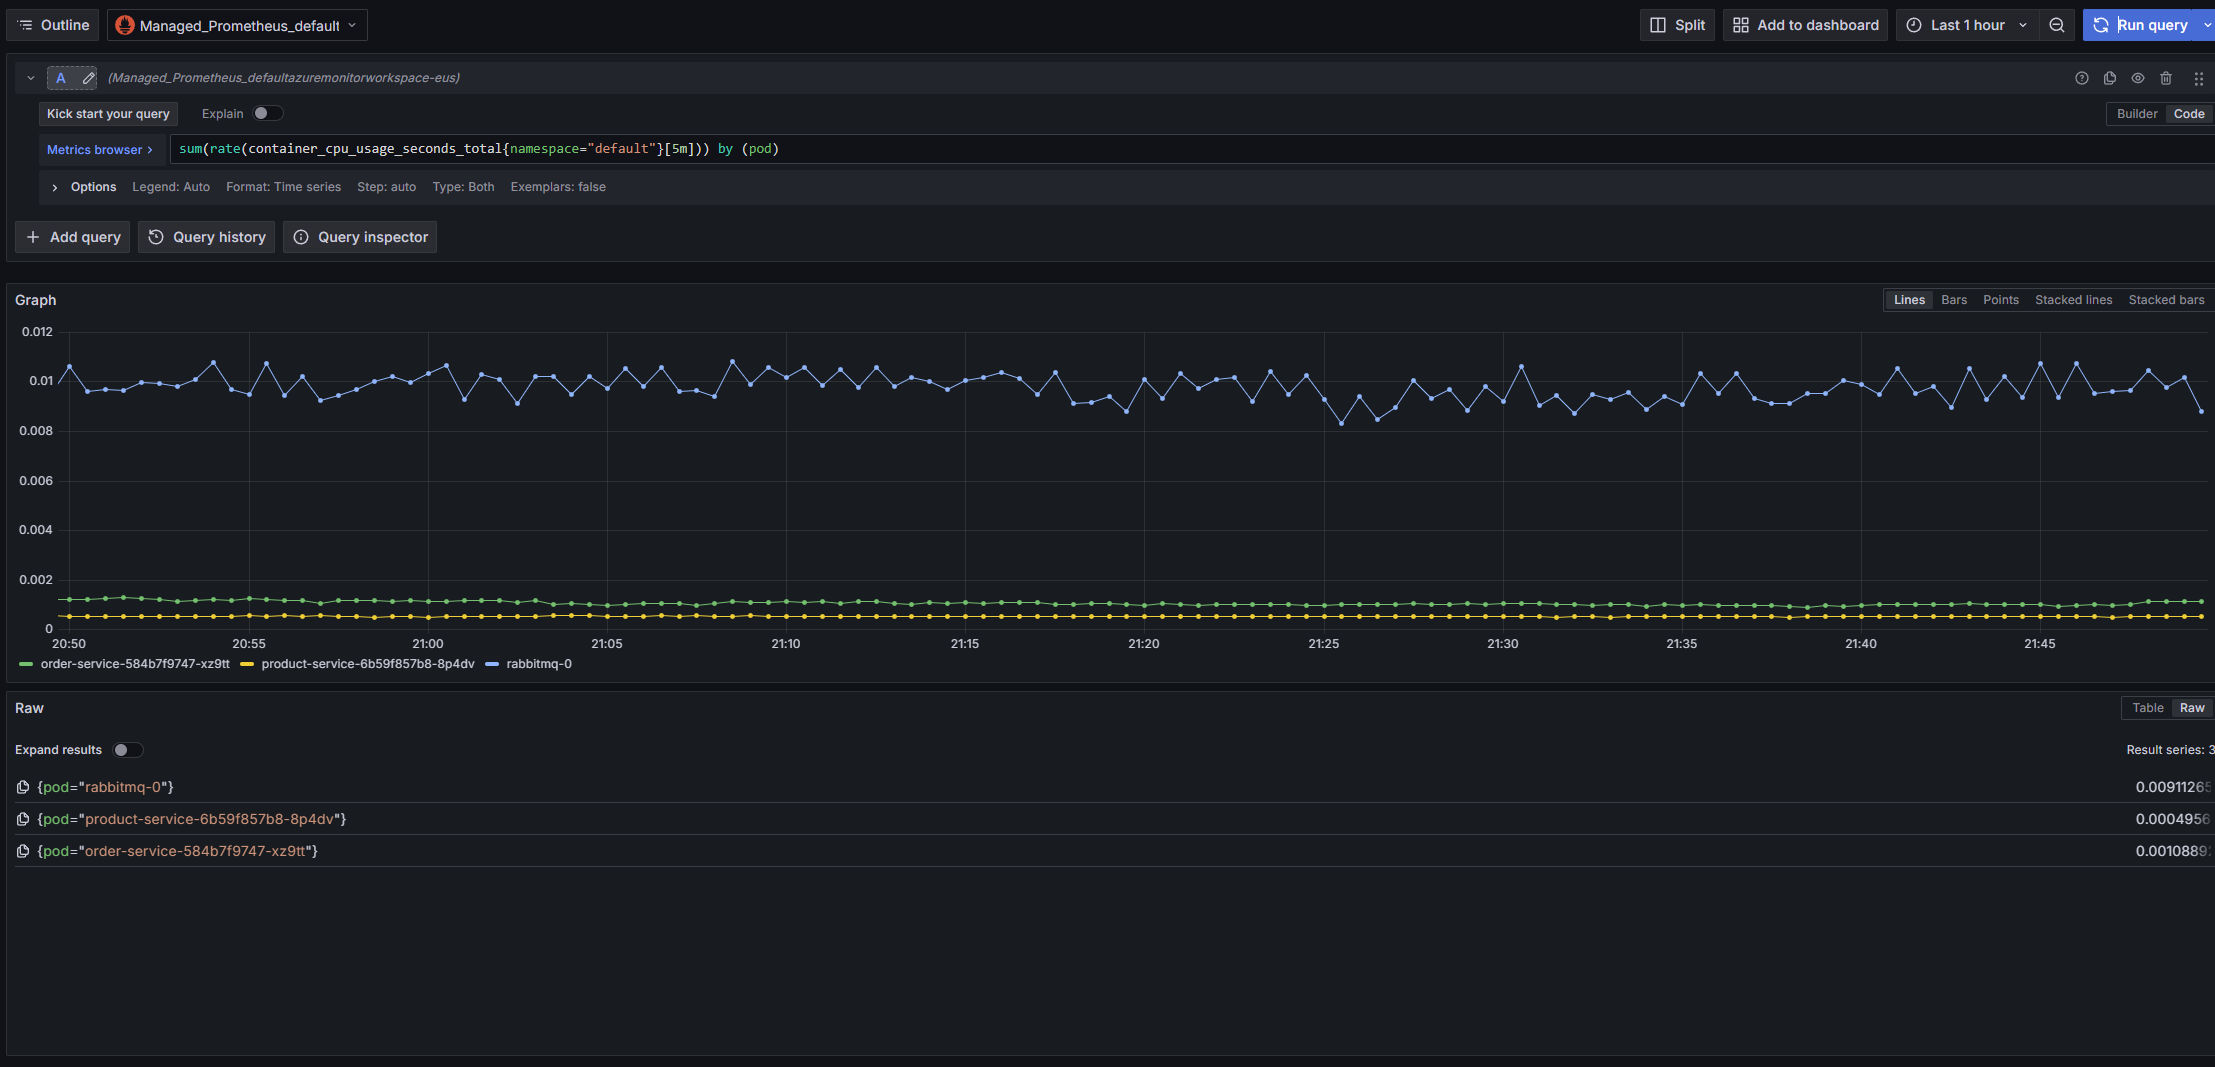
Create Custom Dashboards
For more specific monitoring needs, you can create custom dashboards:
Go to "Dashboards" → "New" → "New dashboard"
Click "Add visualization."
Select your Prometheus data source
Enter a PromQL query, such as:
sum(rate(container_cpu_usage_seconds_total{namespace="default"}[5m])) by (pod)
Configure the visualization settings (type, axes, legend, etc.)
Save the visualization and add it to your dashboard
Add more panels as needed
Save the dashboard
Custom dashboards allow you to focus on the metrics that matter most to your applications and workloads. You can create different dashboards for different aspects of your system, such as:
Cluster-level metrics (node CPU, memory, disk usage)
When creating custom dashboards, organizing related metrics and using templates and variables to make them more reusable and interactive is good practice.
Cost Considerations and Optimization
While Azure Managed Prometheus and Grafana offer significant benefits, it's important to consider the cost implications:
Understanding the Pricing Model
Azure Monitor Managed Service for Prometheus is priced based on data ingestion and retention
Azure Managed Grafana is priced based on the number of editors (users who can create and edit dashboards)
The costs can add up quickly, especially for large clusters with high metric cardinality. I learned this the hard way when I enabled all the default exporters on the cluster I run for my tests and this blog, and boy; the costs do go up.
Strategies for Cost Optimization
Be selective with metrics collection - Not all metrics are equally valuable. Focus on collecting metrics that provide actionable insights.
Reduce metric cardinality —High-cardinality metrics (those with many unique label combinations) can significantly increase costs. Consider limiting labels on high-volume metrics.
Adjust scraping intervals - The default scraping interval is often 15 or 30 seconds. You might consider increasing this interval for metrics that don't change rapidly.
Implement appropriate retention policies - Keep high-resolution metrics for a shorter period and aggregated metrics for longer.
Monitor usage regularly - Monitor your data ingestion rates and adjust your collection strategy as needed.
Implementing these strategies can help you control costs while getting the necessary monitoring insights.
Limitations and Challenges
While these managed applications offer significant advantages, there are some limitations to be aware of:
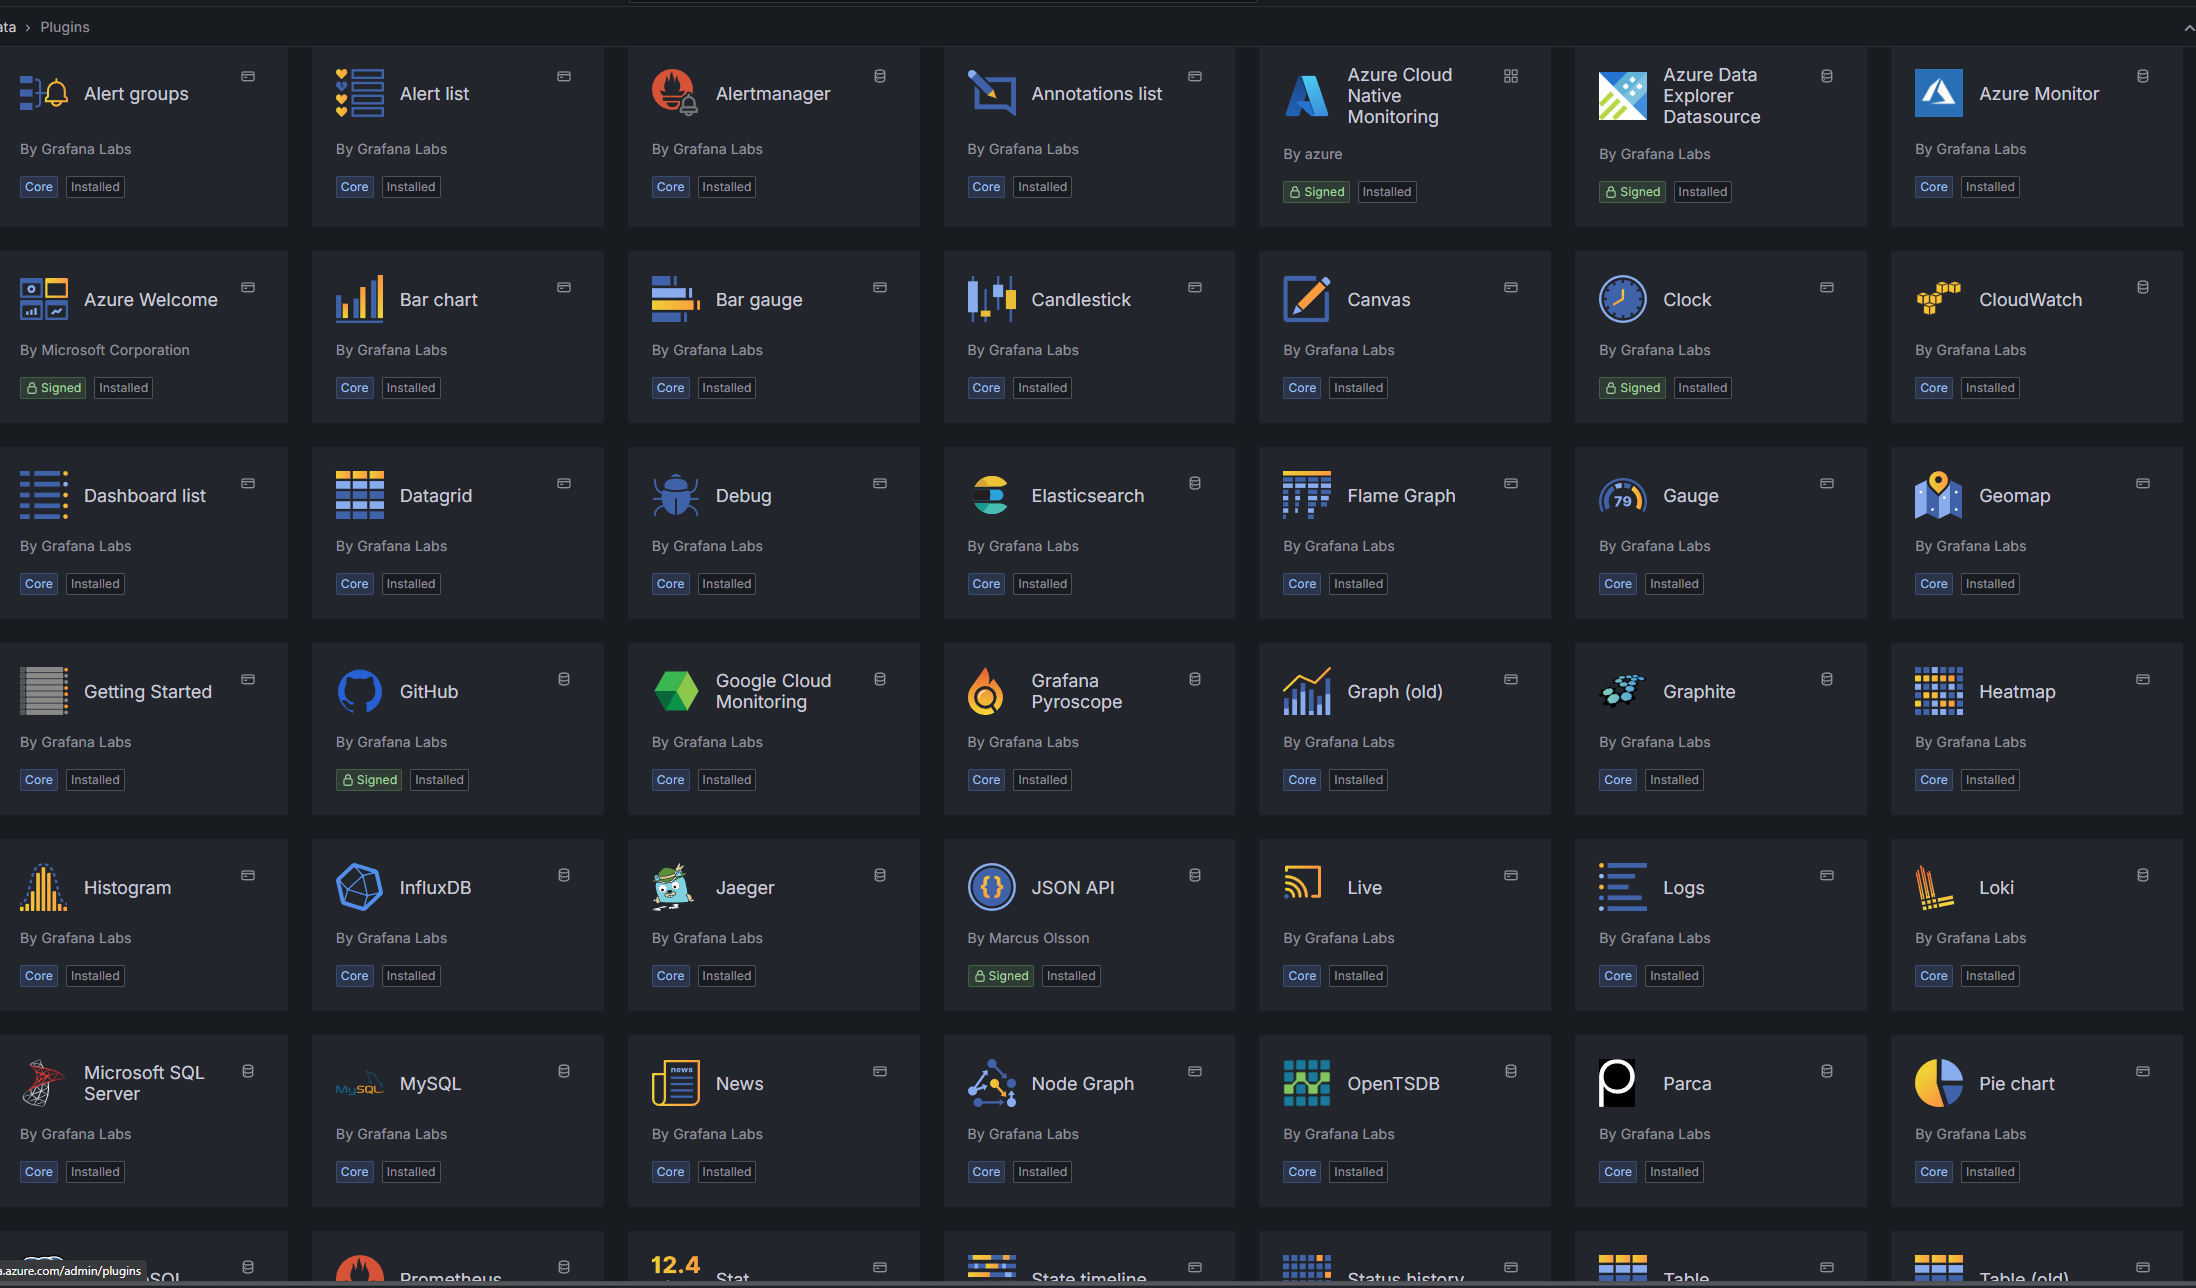
Plugin availability - Not all Grafana plugins in the managed service may be available. If you rely on specific plugins, verify their availability before migrating.
PromQL compatibility - While most PromQL features are supported, there might be subtle differences from open-source Prometheus that can trip you up.
Dashboard sharing - Options for sharing dashboards outside your organization are more limited than self-hosted Grafana.
Authentication options - Authentication is primarily through Microsoft Entra ID, which might not be ideal for all scenarios.
Custom scraping configurations - The managed service has some limitations on customizing the scraping configuration compared to self-hosted Prometheus.
Understanding these limitations can help you make an informed decision and plan your monitoring strategy accordingly.
Compared with Alternative Monitoring Solutions
To provide context, let's briefly compare Azure Managed Prometheus and Grafana with some alternative monitoring solutions:
Monitoring Solution
Pros
Cons
Self-Hosted Prometheus and Grafana
Full control over configuration and features
No additional cost beyond infrastructure
Access to all plugins and features
Operational overhead of management
Need to handle scaling and high availability
Storage management challenges
Azure Monitor Container Insights
Native Azure integration
Simpler setup for basic monitoring
Built-in visualizations in Azure portal
Less flexible queries compared to PromQL
Limited customization of metrics collection
May not support all Kubernetes metrics
Third-Party SaaS Solutions (Datadog, New Relic, etc.)
Comprehensive feature sets
Pre-built dashboards and integrations
Often include APM and other monitoring capabilities
Generally higher cost
Less deep integration with Azure
May require additional agents
As you can see, the right choice depends on your requirements. If you're a full Azure shop, it's pretty much a no-brainer.
Is This Right for You?
After having nightmares with these two applications when I had to debug, fix, recover and work, the answer is yes, without a doubt. Going deeper, they eliminate the operational overhead while maintaining compatibility with the tools many teams already know and love.
If you have a choice between going self-hosted in production and the managed offering, I recommend going with the managed approach, as the engineering effort required to fix or manage it outweighs the cost.
The main considerations are cost, which can be much higher in huge environments, the lack of flexibility compared to the self-hosted offering and some specific tidbits available on the self-hosted variant.
In the end, the decision should be based on your specific requirements and priorities. If operational simplicity and integration with Azure are essential to you, the managed services are likely the right choice.
Node image retirement is not an emergency if you treat it as a predictable operating model. How to migrate images without chaos, what to test, and how to govern the decision.
APIM isn't just a gateway. It's a governance layer that enforces consistency across AKS, Container Apps, and other platforms. When to use it and when to keep things simple.
Network policy is not theoretical; Cilium and eBPF make it practical. Learn when segmentation actually matters, how to observe before you enforce, and why most teams get it wrong at first.


