Azure Kubernetes Service (AKS) often presents itself as a fully managed Kubernetes – but any seasoned DevOps engineer knows that running production workloads in AKS still requires understanding its internals. In this deep dive, we'll explore what happens under an AKS cluster's hood and how to maintain it effectively. We'll dissect the node-level architecture (kubelet and friends) and how it ties into Azure VM Scale Sets, unveil how Azure implements the Kubernetes control plane (including high availability and upgrades via Azure's resource providers), untangle the Azure-specific networking model (comparing Kubenet vs Azure CNI, overlay vs traditional), walk through the node pool lifecycle (scaling, upgrades, taints/labels, draining), and review the built-in monitoring and debugging tools that integrate with AKS. Along the way, we'll compare notes with AWS EKS and GCP GKE, highlighting similarities and differences that experienced K8s engineers will appreciate.
AKS Node Internals: Kubelet, VMSS, and Node Components
At the heart of every Kubernetes cluster are the nodes, and AKS is no exception. In AKS, nodes are Azure Virtual Machines that run your container workloads. These VMs are organized into node pools backed by Azure Virtual Machine Scale Sets (VMSS) for easy scaling. Every node runs the standard Kubernetes node components: the kubelet (which ensures containers/pods are running), kube-proxy (which programs networking rules for service routing), and a container runtime (which runs the containers, now containerd by default in AKS). AKS nodes use an OS image based on Ubuntu or Azure Linux with Kubernetes components pre-installed, and they come with sensible defaults (like reserved system resources and ephemeral OS disks) to suit Kubernetes workloads.
Integration with Azure VMSS: Azure creates or adjusts a VM Scale Set behind the sceneswhen you create or scale a node pool in AKS. All VMs in a node pool share the same configuration (VM size, OS, Kubernetes version). The VMSS integration means you can treat a node pool as a single unit for scaling and upgrades – AKS will add or remove identical VM instances as needed. Every VMSS-based node pool lives in a separate Azure resource group (the MC_* resource group that AKS manages for you) and related resources like the VMs' NICs and disks. The kubelet on each node registers the node with the AKS control plane, using cloud-init and Azure agent settings to join the cluster automatically. From that point, the control plane sees a new node object with labels like agentpool=<poolName> and other Azure-specific labels (for example, AKS adds kubernetes.azure.com/role=agent on all agent nodes).
Node auto-repairs and health monitoring: One advantage of AKS managing the node VMSS is that it can perform health monitoring and automated repairs. If a node becomes unhealthy (unready for too long, etc.), AKS can detect this and initiate replacing that VM in the scale set. In fact, automatic node health repair is a built-in feature of AKS, and the system will cordon and reimage or reboot nodes that fail health probes, reducing manual intervention. (By contrast, in EKS, similar functionality exists when using Managed Node Groups, and in GKE, node auto-repair can be enabled to achieve the same effect.)
It's worth noting that the Azure cloud controller manager integrates with the kubelet and API server to tie nodes into Azure infrastructure. For example, when you create a Persistent Volume backed by an Azure Disk, the Azure cloud provider attaches the disk to the right VM; when a Service of type LoadBalancer is created, the cloud controller provisions an Azure Load Balancer and updates it if nodes change. These are cluster-level operations, but they rely on the node's Azure identity and labels. Under the hood, each AKS node runs with an Azure identity (managed identity) that grants permissions for such operations (e.g. attach/detach disks). This allows seamless integration between Kubernetes and Azure resources.
Container runtime details: Since Kubernetes 1.19, AKS uses containerd as the container runtime for Linux nodes (Docker is deprecated). This means the kubelet interfaces with containerd via the CRI, and you won't see a Docker daemon on AKS nodes. Containerd improves stability and resource usage, which is important in a managed setting. Windows node pools (if you use them) also use containerd as of recent Kubernetes versions, ensuring consistency. Knowing the runtime is useful when debugging issues (for example, crictl is available on nodes for troubleshooting containers directly via containerd).
Finally, an AKS node also runs various daemon pods as part of the Azure Kubernetes Service setup. If you list pods in the kube-system namespace, you'll find things like the Azure CNI plugin pods (if using Azure CNI), core DNS, metrics server, and others. The system node pool in AKS is meant to run these critical system pods. By default, your first node pool is flagged as a system node pool, and it will host system pods like CoreDNS and metric-server. It's a best practice (and default AKS behavior) to segregate system pods to that pool and run your application workloads on separate user node pools – this avoids competition for resources between infrastructure and app pods.
Azure-Managed Control Plane: Architecture, HA, and Upgrades
One of the selling points of AKS is that Azure fully manages the control plane – you don't see it or maintain it. But it's important to understand how Azure implements the Kubernetes control plane behind the scenes, especially when considering reliability and upgrades.
What the AKS control plane is: When you create an AKS cluster, Azure spins up a set of Kubernetes master components on your behalf: the API server, etcd (the cluster database), scheduler, controller-manager, and cloud-controller-manager. These components are run in an Azure-managed subscription, not in your own, and you have no direct access to those VMs (which is good from a security and maintenance standpoint). Microsoft operates the control plane as a managed service – including applying updates and patches. The control plane is single tenant for your cluster (unlike some older "multi-tenant" offerings), so you're not sharing an API server with other customers. The API server is exposed via an endpoint in your Azure subscription (either public or private IP), but the machines themselves are hidden.
High availability (HA) and SLA: By default, AKS provides a highly available control plane by running multiple instances of the master components spread across Azure update domains and fault domains. Suppose you enable Availability Zones for your cluster's control plane (a.k.a. use the AKS Standard tier with Uptime SLA). In that case, Azure will even spread the control plane nodes across separate zones for greater resiliency. In practical terms, this means Azure keeps multiple API server replicas and an etcd quorum so that if one goes down (or an entire AZ goes down, in zonal clusters), your cluster's API stays up. With the paid Uptime SLA, Microsoft financially guarantees 99.95% API server availability for zone-redundant clusters (99.9% for single-zone). Without the SLA, the control plane is still redundant, but the guarantee is lower, and it's provided as a free service. For comparison, AWS EKS runs control plane nodes across three AZs by default and offers 99.95% SLA out-of-the-box (though historically, EKS charged a fixed fee for control plane). GKE offers a choice: a zonal cluster (single control-plane node, no HA) or a regional cluster with three control-plane replicas spread across zones cloud.google.com for high availability. In AKS, you don't choose the number of control-plane nodes – it's managed for you – but you do choose if you want zone redundancy and an SLA.
Azure Resource Manager and CRP (Compute Resource Provider): The Azure control plane is orchestrated through Azure Resource Manager (ARM). When you create or update an AKS cluster (via CLI, portal, or an ARM/Bicep template), you're interacting with the Azure Compute Service Resource Provider. This is an Azure service that translates your ARM API calls (like "create cluster with X config" or "upgrade cluster to version Y") into actions on the Kubernetes control plane and Azure infrastructure. For instance, if you request an upgrade, the CRP will initiate the upgrade process on the masters (and then agent nodes) in the background. Understanding this is useful: your cluster is essentially defined as an ARM resource (Microsoft.ContainerService/ManagedClusters), and any change goes through Azure's control plane for AKS. The "Kubernetes control plane" thus has two meanings here – the Kubernetes masters themselves and the Azure management layer that keeps them running. The latter ensures things like etcd backups, API server scaling, and integration with other Azure features (Azure AD, network resources) happen reliably.
Upgrading the control plane: Upgrades in AKS are a two-step process: first, the control plane, and then the nodes. When you issue an AKS upgrade (or when one is triggered automatically if you've opted into auto-upgrade), Azure will upgrade the control plane components to the target Kubernetes version. This is done by Azure behind the scenes – likely by bringing up new API server instances at the new version and switching traffic, ensuring etcd is upgraded and data is intact (Azure doesn't detail the exact method, but it's zero-downtime or minimal-downtime from the user perspective). After the masters are upgraded (you'll notice az aks get-upgrades showing the new control plane version available), you then upgrade node pools. Azure allows control plane upgrades one minor version at a time and supports up to N-2 versions; this is similar to EKS and GKE (each has its skew policy). During the control plane upgrade, your Kubernetes API might momentarily be unavailable as leadership changes, but generally, Azure keeps it short and transparent.
It's worth noting that you cannot directly access the control plane logs on AKS (unlike EKS, where you can funnel API server logs to CloudWatch). However, Azure is continuously monitoring the control plane for you. If something is wrong at that level, Microsoft likely already knows from telemetry. For advanced use cases, AKS offers diagnostic settings to retrieve audit logs or diagnostic info from the control plane, but it's not commonly needed unless debugging an Azure support case.
To summarize, the AKS control plane is managed as a black box that you don't maintain, but you should be aware of its SLA and how upgrades are orchestrated. Always opt for zone-redundant control plane in production if possible and plan your upgrade cadence so that you don't fall too far behind (AKS encourages staying close to latest; EKS might support older versions longer, but Azure moves fast).
Networking: Azure CNI (Overlay & Traditional) vs. Kubenet
Networking in AKS has some Azure-specific twists that you must plan for. The choice between kubenet and Azure CNI (and further between Azure CNI Overlay or traditional) affects how your pods get IP addresses and connect to other resources. Let's break down these models and their practical implications.
Azure CNI (Traditional "VNet" mode): The default for AKS (unless you choose otherwise) is Azure CNI where every Pod gets an IP address from the Azure Virtual Network (VNet) subnet that the cluster is attached to. In this model, your node's VM and the pods running on it all share the same VNet, each with its own IP. This provides direct layer-3 connectivity between pods and any other resources on the VNet (or on-prem via VPN, etc.) – a pod IP is just another IP on the network. The advantage is clear: no additional NAT for pod traffic inside the VNet, and other Azure services can reach pods if needed. However, the trade-off is IP address consumption. Every pod takes a VNet IP, which means you need a large enough subnet to accommodate worst-case pod density. Careful IP planning is required to ensure you don't run out of addresses as you scale. For example, if you have 100 nodes and each node by default can host up to 30 pods, that could be up to 3000 IPs – your subnet must be sized accordingly (plus some headroom). Expanding a subnet later is non-trivial if it's already in use, so this needs upfront planning. AWS's EKS has a very similar default networking approach via the AWS VPC CNI – each pod gets an IP from the VPC, and they faced the same IP exhaustion issues (AWS mitigated it with features like prefix assignments to reduce IP waste).
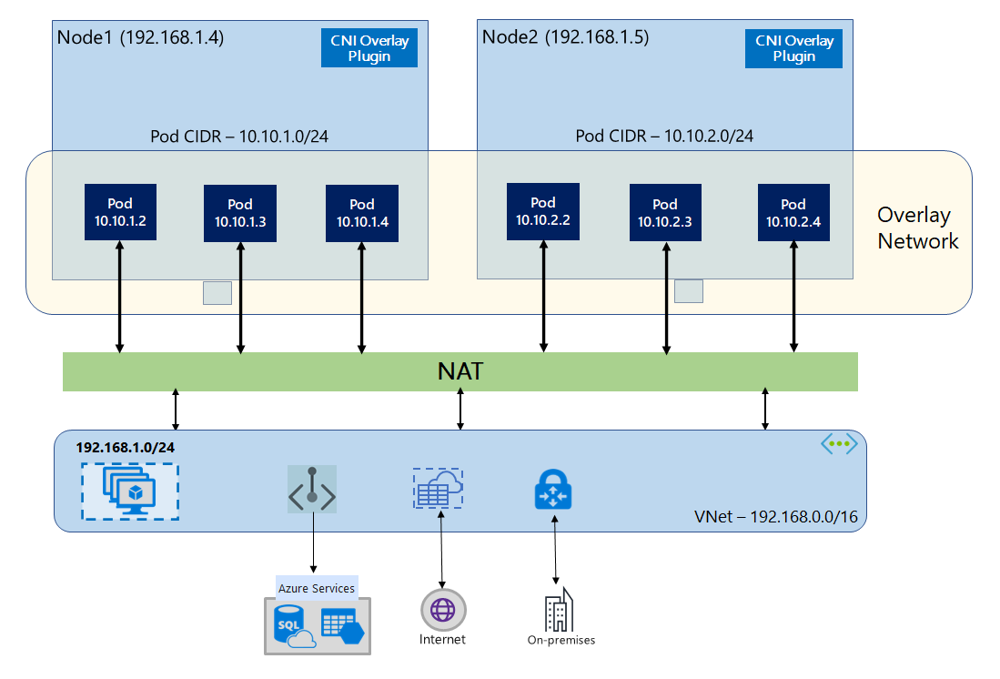
Azure CNI Overlay: To address the IP exhaustion and management complexity, AKS introduced Azure CNI Overlay networking. In overlay mode, your nodes still live in an Azure VNet and have VNet IPs, but pods get IPs from a separate, non-routable CIDR that you specify for the cluster (for example, 10.244.0.0/16, or anything that doesn't overlap with your network). Pod traffic between nodes is handled via an overlay network created in Azure's network stack, and when pods need to talk to anything outside the cluster, their traffic is NAT'ed via the node's IP (the node acts as the egress point). Essentially, overlay gives pods IPs that are only meaningful within the cluster; the nodes still have real Azure IPs and do the translation for external communication. What's the benefit? It massively reduces the VNet IP count needed. You could have a /16 for pods (which gives ~65k addresses) without consuming any of those in the Azure VNet itself, because Azure isn't assigning them on the VNet – it's using an overlay. This means your cluster can scale to very large numbers of pods without exhausting VNet space. Another benefit is that you can reuse the same pod CIDR across multiple clusters without conflict (since those pod networks don't exist outside their cluster). The trade-offs: since pods aren't directly on the VNet, no other Azure resource can directly reach a pod IP – you'd have to go through some proxy (like a Service IP or ingress). Also, traffic from pods to Azure resources will appear as coming from the node's IP (due to NAT). In practice, this is similar to kubenet (and many traditional CNI setups) behavior. Performance-wise, Azure claims the overlay has near parity with non-overlay in terms of latency and throughput, because they implement it at the platform level without encapsulation overhead.
Azure CNI Overlay networking – pods on each node get IPs from a private CIDR (e.g., 10.10.1.0/24 on Node1, 10.10.2.0/24 on Node2) distinct from the VNet's 192.168.1.0/24. Pod-to-pod traffic stays within an overlay network, while any traffic leaving the cluster (to Azure services, on-prem, internet) is NAT'd via the node's VNet IP. This allows thousands of pods without consuming equivalent VNet IPs
When should you use overlay? If you anticipate a large cluster with dense pod counts or you have limited IP space in your VNet, overlay mode is a lifesaver. The main consideration is whether your pods need to be directly reachable from the VNet. For example, if you have monitoring agents on a VM that need to scrape pod IPs or legacy systems that connect to pod IPs, those won't work with overlay (because the pods only exist in the overlay network). In such cases, traditional Azure CNI is better. Otherwise, overlay gives you scalability and simpler IP management.
Kubenet (basic networking): Kubenet is the older, simpler networking option for AKS. If you choose kubenet, your pods will NOT get VNet IP addresses at all. Instead, each node is assigned an IP range for pods (such as 10.244.1.0/24 for node1, 10.244.2.0/24 for node2, etc.), and the pods get IPs from that range. These pod IPs are not routable in the Azure VNet directly; kubenet relies on Azure routing or user-defined routes to ensure pods can talk across nodes. For egress traffic (pod to internet or Azure service), it masquerades (NAT) through the node's IP. Essentially, with kubenet, the node's network interface is the gateway for its pods. The benefits are: very low IP overhead (pods don't consume VNet IPs, similar to overlay) and it's lightweight/simple, often resulting in lower cloud networking costs (no additional attachments). Kubenet's downsides are that pods have limited connectivity: a pod cannot be reached directly from outside the node's VM – you'd have to go through something like a Service with a load balancer or port forwarding. Also, any traffic from pod to Azure resource will have an extra hop (via NAT) and possibly a slight latency hit. Kubenet is considered legacy now, because Azure CNI overlay offers a similar IP-saving benefit without requiring manual route configuration. In fact, Azure's documentation now calls kubenet a "legacy CNI option" and suggests using Azure CNI variants for most scenarios.
In practice, kubenet might be suitable for small clusters, dev/test environments, or cases where you truly have no need for direct network connectivity to pods and want to minimize IP usage and plugin overhead. Many production AKS deployments have moved to Azure CNI (with or without overlay) for better integration. If you do use kubenet, behind-the-scenes AKS manages a route table in your VNet: it adds routes for each node's pod CIDR pointing to that node's IP, so that inter-node pod traffic knows how to travel. If your cluster VNet peers with other networks, you'd have to propagate those routes or use BGP, etc., which can get complicated – another reason many prefer Azure CNI, where pods are just IPs on the VNet.
Network Policy and plugins: Regardless of chosen networking, you can implement Kubernetes Network Policies for security. With Azure CNI (both modes), you can use Azure's own NP implementation or use Calico for Network Policy. With kubenet, typically you'd install Calico network policy plugin since Azure's NP doesn't work there. Also, Azure is evolving its CNI with new tech – e.g., Azure CNI powered by Cilium (currently an option) which can provide eBPF-based data plane and enhanced policy, and might become the default in the future.
Cross-cloud comparison: AWS EKS by default uses an AWS-vended CNI that is very similar to Azure CNI traditional – each pod gets an IP from the VPC subnets. That has similar scalability concerns; AWS's solution includes attaching multiple ENIs to nodes and even assigning entire secondary IP prefixes to each node to increase pod density. AWS now also supports alternate CNIs (like Calico in overlay mode) if you need to avoid the IP limits. GCP's GKE default networking uses VPC Native (alias IP), where each node automatically gets a chunk of IPs from a secondary range in the VPC to use for pods – effectively accomplishing the same goal as Azure CNI overlay but in a Google-specific way. GKE also had a route-based networking (similar to kubenet) for legacy reasons, but it's largely phased out in favor of alias IPs. The trend is clearly towards models that reduce IP management burden while maintaining performance, which is why AKS overlay is important to know.
Node Pool Lifecycle: Scaling, Upgrades, Taints & Draining
A robust AKS cluster is not static – you will be scaling node pools up/down, upgrading Kubernetes versions, and perhaps reconfiguring node pools for specific workloads (using taints, labels, etc.). Understanding how AKS handles these actions helps you plan maintenance with minimal downtime.
Node Pools and scaling: In AKS, you can have multiple node pools, each backing a group of VMs (VMSS) with a certain SKU, OS, or configuration. You might have a system node pool (for system pods) using, say, D2s_v3 VMs, and a user pool for general workloads using D4s_v3, and another with GPU instances for ML workloads. AKS supports scaling each node pool independently. Scaling is simply an update to the VMSS instance count. You can do this manually (az aks scale or az aks nodepool scale) or automatically. AKS integrates the Cluster Autoscaler – which, when enabled, will watch your pods and scale node pools up if pods are pending (and scale down if nodes are underutilized and pods can be rescheduled). The cluster autoscaler in AKS is the same core logic as upstream and is configured to talk to Azure's VMSS APIs. It's worth enabling for production clusters to handle sudden changes in load. Keep in mind that scaling down will respect Pod Disruption Budgets (PDBs) if you have them, and it will drain nodes before deletion.
One cool feature with AKS VMSS-based pools is you can use surge scaling (temporarily going above the desired count) during upgrades – we'll discuss that next. Also, you can add and remove entire node pools on the fly. This is useful if you want to migrate to new VM types or segregate workloads.
For example, to add a pool:
az aks nodepool add -g myRG -n myCluster --name gpuPOOL --node-vm-size Standard_NC6 --node-count 2 --labels workload=gpu --node-taints sku=gpu:NoSchedule
This will create a new node pool named "gpuPOOL" with 2 GPU nodes, labeled and tainted for GPU workloads. This flexibility means your cluster can evolve (much like EKS's managed node groups or GKE's node pools).
Upgrading Kubernetes (node pools): After the control plane is upgraded to a new version, you'll want to upgrade the nodes. AKS performs rolling upgrades on node pools with minimal disruption. The upgrade process for a node pool is: add a new node at the target version, drain an old node, delete the old node, and repeat. By default AKS will do this one node at a time (to avoid mass eviction of pods) using a surge of 1 node. This means if you have N nodes, it temporarily goes to N+1 (adding one), moves everything, then goes back to N by removing one, and so on. The parameter controlling this is maxSurge in the upgrade settings. AKS defaults maxSurge=1 (or 1 node) which is very conservative. You can tune this – for example, if you set maxSurge=33% on a pool of 30 nodes, it could spin up 10 extra nodes and drain 10 at a time, making upgrades faster at the cost of evicting more pods in parallel. In production, a safe middle-ground (like 33% as suggested by AKS docs) can significantly speed up upgrades without compromising availability. The key is that AKS will cordon and drain nodes gracefully during this process. "Draining" means it evicts all pods from the node (respecting termination grace periods and PDBs). If a pod cannot be evicted (say it has maxUnavailable=0 PDB and a single replica), the upgrade will pause or eventually mark the node as "undrainable". AKS has logic now to handle such stuck evictions: it can quarantine a node if drain fails, label it with azure.com/upgrade=quarantined, and proceed. You as the operator then need to fix whatever prevented eviction (maybe adjust the PDB or downtime for that component) and manually remove that quarantine label to let AKS retry. This is an improvement – in the past, a single pod with no disruption budget could stall the entire upgrade.
AKS recently introduced configurable node drain timeouts as well. By default, it waits up to 30 minutes for pods to evict on one node. If you have very long-lived shutting-down processes, you can increase this timeout (or decrease it if you want faster failover) on a per-node pool basis. There's also a node soak time setting – a delay between node replacements – which can be used to give the cluster a breather and ensure the new pods are running healthy before moving on. All these knobs (max surge, drain timeout, soak time) let you tailor the upgrade process to your app's tolerance for disruption. GKE and EKS similarly allow surge upgrades now (GKE has surge and surge-maxUnavailable settings; EKS managed node groups allow setting a max unavailable count), so conceptually, all are aligned in how rolling upgrades happen.
From a practical standpoint, always upgrade your system node pool first (to ensure system pods like DNS are on the new version and to avoid incompatibility if there were any) – AKS doesn't necessarily enforce that, but it's a good practice. Also consider doing upgrades one node pool at a time and monitoring your application. If you have automated CI/CD, you might integrate az aks get-upgrades and az aks nodepool upgrade commands into your pipeline to regularly roll minor version updates.
Taints and labels for workload placement: AKS allows you to specify taints on node pools (either at creation or by kubectl on individual nodes). By tainting a node pool, you can reserve it for certain workloads. For example, you might taint a pool with workload=gpu:NoSchedule for GPU nodes and add a toleration in your GPU-using Pod specs so they land there. This ensures other pods don't accidentally get scheduled onto expensive GPU machines. AKS doesn't auto-taint the system node pool by default, but you could taint it with something like node-role=system:NoSchedule and add tolerations to only system pods (though since system pods are usually deployed as DaemonSets or with node selectors for "kubernetes.azure.com/mode=system", it's often not needed). Labels are automatically added to nodes for pool name, etc., and you can add your own labels to node pools (e.g., env=prod or tier=frontend) to use with nodeSelector or node affinity in Kubernetes.
This is a powerful way to constrain certain workloads to certain node pools for compliance or performance reasons. All major cloud K8s support this (EKS node groups can be labelled/tainted, GKE node pools too).
abase, set a PDB minAvailable=1 to prevent all replicas going down. This way, AKS's upgrade or autoscaler will evict pods in a controlled manner.
Special cases – Spot node pools and zero-node auto-scale: AKS supports spot VM node pools (cheap but evictable VMs). These pools can scale to zero and back up. You might tolerate that for batch or flex workloads. Just remember spot nodes can go away without draining (Azure gives a 30-second eviction notice, not enough for graceful termination beyond what your app handles). So design those workloads to handle abrupt termination (use ReplicaSets with enough replicas, etc.). The cluster autoscaler in AKS is aware of spot vs regular pools and can scale them differently based on priority. GKE has a similar concept (preemptible VMs in node pools), and EKS allows spot instances in managed node groups as well.
Managing node pools in AKS is about automation and control – automation via autoscaler and AKS handling the heavy lifting during upgrades, and control via taints/labels to ensure each workload lands on appropriate nodes. Always test your pod eviction scenarios to see how your apps handle them, and tune the settings (like maxSurge or drain timeouts) if needed for your environment.
Monitoring and Debugging in AKS: Container Insights, Logs and More
Operating a cluster day-to-day means you need visibility into what's happening and tools to troubleshoot when things go wrong. Azure provides a rich set of integrated monitoring and debugging capabilities for AKS. Let's go through the key ones and compare with equivalents in EKS/GKE.
Azure Monitor for Containers (Container Insights): This is Azure's out-of-the-box monitoring solution for AKS. When enabled, it deploys an agent (a DaemonSet) to your cluster that collects metrics and logs. It sends data to an Azure Log Analytics Workspace in your subscription. Container Insights will gather node metrics (CPU, memory, etc.), pod and container metrics, and even scrape Kubernetes metrics (like cluster load, pending pods). It also collects container logs (stdout/stderr from pods) and Kubernetes platform logs (like events). All of this is visible in the Azure Portal under "Insights" for your AKS cluster. You get pre-built dashboards for node performance, controller health, etc., and you can run queries against the log data using Kusto Query Language (KQL) in the Logs blade. For example, you can query all container logs for a namespace with a few clicks, or see memory usage of a particular deployment over time.
Container Insights gives AKS a similar experience to GKE's Stackdriver (Cloud Logging/Monitoring) integration, or EKS with CloudWatch Container Insights. The difference is in Azure's implementation: data goes to Log Analytics (which is part of Azure Monitor). If you prefer open-source tools, you can still deploy Prometheus/Grafana or EFK stack on AKS, but Azure Monitor is ready to go without that effort. In fact, Azure has a managed Prometheus service that can scrape metrics from AKS without you running a full Prom stack yourself. Under the hood, the Container Insights agent can scrape Prometheus metrics from pods if you annotate them, and Azure Monitor can store those. Or you can enable the dedicated managed Prometheus, which works with Azure Monitor Managed Grafana for a more cloud-native approach.
Logs and diagnostics: All logs collected by Container Insights end up in the Log Analytics workspace. You can search them with queries or set up alerts (for example, trigger an alert if a pod logs an error message matching X). Additionally, AKS can send audit logs and kube event logs to Log Analytics or Azure Event Hub if you configure diagnostic settings. This could include Kubernetes API audit records, etc., which might be useful for security auditing. By default, those aren't enabled, to save cost – you opt-in via Azure Monitor diagnostic settings on the AKS resource.
Real-time and on-cluster debugging: Sometimes you need to get live access to your cluster for debugging. One handy feature is Azure "Run Command" for AKS, which allows you to execute kubectl commands directly on the cluster from the Azure Portal or CLI (without needing to set up kubectl locally or if your cluster API is private).
For example, you can run:
az aks command invoke -g myRG -n myCluster --command "kubectl describe pod <podname> -n <ns>"
Which will get the output immediately, even from a private cluster. This is great for quick diagnostics when you don't have direct network access to the API.
Kubernetes itself provides tools like kubectl exec (to get a shell in a running container) and kubectl logs (to stream logs). These work on AKS as on any K8s. Additionally, kubectl debug with ephemeral containers is available in newer Kubernetes – allowing you to attach a new container to a running pod's namespace for troubleshooting (useful to, say, run tcpdump in a Pod that didn't originally have it).
AKS-specific diagnostic tools: Microsoft provides AKS Periscope – an open-source tool that you can run to gather diagnostic info from all nodes (like node logs, dmesg, container runtime info, network diagnostics).
It's packaged as a container that can be run manually or through the Azure Portal's "Diagnose and solve problems" section. In fact, the portal's AKS Diagnose and Solve Problems is a one-stop utility that runs a set of diagnostic checks for common issues (node not ready, networking issues, DNS resolution issues, etc.) and gives you a report. It can automatically deploy Periscope to collect logs when you trigger a verbose investigation. This is extremely handy when you're facing something like a crashlooping kubelet or CNI problems – you click a button and get a bunch of logs and suggestions. Think of it as Azure's on-demand "health check-up" for your cluster.
For comparison, EKS doesn't have as rich a built-in diagnostics UI – you'd mostly rely on CloudWatch logs and kubectl for troubleshooting, or third-party tools. GKE has some built-in diagnostics (GKE Doctor can detect certain issues, and the cloud console can show events and errors). But Azure's approach with the Diagnose and Solve blade is quite user-friendly, especially if you're not sure where to start debugging.
Azure Monitor Alerts and Insights: Beyond raw data, you should set up alerts on important signals. For example, you can create an alert rule in Azure Monitor if a node's CPU remains above 90% for 10 minutes or if a certain error appears in logs frequently. There are also predefined alerts possible, like "if a cluster node count changes" (to detect unexpected scale events) or "if a pod has been restarting repeatedly". These can integrate into Azure's alerting system, sending to email, Teams, PagerDuty, etc. Additionally, Azure Advisor may once in a while surface recommendations for your AKS cluster (like "upgrade your version" or "enable VMSS orchestration mode X"), but those are more static checks.
Security and audit monitoring: For those concerned with security, Azure provides Defender for Kubernetes which can monitor AKS clusters for suspicious activities and misconfigurations. It plugs into the same data sources (audits, logs) and can raise alerts on things like a pod running with privileged permissions or a crypto mining container detected. This goes beyond pure ops into SecOps, but it's worth mentioning as part of the operated cluster's toolset.
All in all, AKS gives you a managed observability stack out of the box: metrics, logs, and visuals via Container Insights plus deep diagnostics via the portal and CLI. It's wise to enable these on any production cluster – they can be the difference between finding an issue in minutes versus hours. And if you prefer open-source monitoring (Prometheus/Grafana/EFK), AKS is flexible – you can run those yourself or use Azure's managed alternatives (Managed Prometheus, Managed Grafana, Azure OpenSearch, etc.). The key is to ensure you have visibility at all levels: control plane (mostly given by Azure), node health (node metrics and events), and application health (pod logs, Prometheus metrics).
Lastly, as an SRE mindset, practice failure scenarios on AKS: kill a node and see if auto-repair replaces it, simulate a pod crash and ensure alerts fire, try out the kubectl debug to make sure your team knows how to use it. AKS's tooling will handle a lot, but knowing the ins and outs as we've covered will make you confident running even the most demanding production workloads on Azure Kubernetes Service.
Maintaining a production-grade AKS cluster involves understanding both Kubernetes internals and Azure's specific implementations. We saw how the kubelet and node components run on Azure VM Scale Sets, giving you elasticity and Azure integration out-of-the-box. We demystified the AKS control plane – a managed Kubernetes master replicated for high availability, patched and operated by Microsoft, but up to you to upgrade on your schedule. We dove into networking, comparing Azure CNI vs. kubenet, and highlighted the new overlay networking that can save you from IP exhaustion headaches. We walked through the node pool lifecycle – from scaling out to upgrading gracefully with surge nodes and respecting Pod Disruption Budgets. And we explored the rich monitoring and diagnostics landscape in AKS, from Container Insights to AKS Periscope, which keeps your ops efficient and transparent.
Running AKS in production is not a set-and-forget affair – you'll be applying upgrades every few months (AKS's fast pace with Kubernetes releases means you should keep up), watching cluster autoscaler logs to ensure it scales as expected, and tuning things like node sizing and network modes as your architecture evolves. The good news is that Azure has invested heavily in the managed aspects: you don't need to manage etcd or control plane VM failures, and features like automatic node repair, integrated logging, and hybrid networking modes give you a polished experience. In many ways, AKS now offers capabilities on par or beyond its AWS and GCP counterparts: for instance, the combination of Azure CNI Overlay and managed Prometheus/Grafana is something neither EKS nor GKE provided in the exact same way until recently.
Treat your Kubernetes cluster as cattle, not a pet – even the cluster itself. Embrace automation (CI/CD pipelines for AKS changes, Terraform or Bicep for cluster definitions, auto-scaler for nodes, etc.), and practice chaos engineering on the cluster (Azure won't mind – it's built to handle it!). By understanding the internals covered above, you'll know exactly how AKS will react under the hood, and you'll sleep better when that 3 AM page comes in.
Node image retirement is not an emergency if you treat it as a predictable operating model. How to migrate images without chaos, what to test, and how to govern the decision.
APIM isn't just a gateway. It's a governance layer that enforces consistency across AKS, Container Apps, and other platforms. When to use it and when to keep things simple.
Network policy is not theoretical; Cilium and eBPF make it practical. Learn when segmentation actually matters, how to observe before you enforce, and why most teams get it wrong at first.


