AKS Automatic - Kubernetes without headaches
This article examines AKS Automatic, a new, managed way to run Kubernetes on Azure. If you want to simplify cluster management and reduce manual work, read on to see if AKS Automatic fits your needs.
I’ve discussed about AKS before but recently I have been doing a lot of production deployments of AKS, and the recent deployment I’ve done was with Nvidia GPUs.
This blog post will take you through my learnings after dealing with a deploying of this type because boy some things are not that simple as they look.
The first problems come after deploying the cluster. Most of the times if not all, the NVIDIA driver doesn’t get installed and you cannot deploy any type of GPU constrained resources. The solution is to basically install an NVIDIA daemon and go from there but that also depends on the AKS version.
For example, if your AKS is running version 1.10 or 1.11 then the NVIDIA Daemon plugin must be 1.10 or 1.11 or anything that matches your version located here
apiVersion: extensions/v1beta1
kind: DaemonSet
metadata:
  labels:
    kubernetes.io/cluster-service: "true"
  name: nvidia-device-plugin
  namespace: gpu-resources
spec:
  template:
    metadata:
      # Mark this pod as a critical add-on; when enabled, the critical add-on scheduler
      # reserves resources for critical add-on pods so that they can be rescheduled after
      # a failure.  This annotation works in tandem with the toleration below.
      annotations:
        scheduler.alpha.kubernetes.io/critical-pod: ""
      labels:
        name: nvidia-device-plugin-ds
    spec:
      tolerations:
      # Allow this pod to be rescheduled while the node is in "critical add-ons only" mode.
      # This, along with the annotation above marks this pod as a critical add-on.
      - key: CriticalAddonsOnly
        operator: Exists
      containers:
      - image: nvidia/k8s-device-plugin:1.10 # Update this tag to match your Kubernetes version
        name: nvidia-device-plugin-ctr
        securityContext:
          allowPrivilegeEscalation: false
          capabilities:
            drop: ["ALL"]
        volumeMounts:
          - name: device-plugin
            mountPath: /var/lib/kubelet/device-plugins
      volumes:
        - name: device-plugin
          hostPath:
            path: /var/lib/kubelet/device-plugins
      nodeSelector:
        beta.kubernetes.io/os: linux
        accelerator: nvidia
The code snip from above creates a DaemonSet that installs the NVIDIA driver on all the nodes that are provisioned in your cluster. So for three nodes, you will have 3 Nvidia pods.
The problem that can appear is when you upgrade your cluster. You go to Azure and upgrade the cluster and guess what, you forgot to update the yaml file and everything that relies on those GPUs dies on you.
The best example I can give is the TensorFlow Serving container which crashed with a very “informative” error that the Nvidia version was wrong.
Other problems that appear is monitoring. How can I monitor GPU usage? What tools should I use?
Here you have a good solution which can be deployed via Helm. If you do a helm search for
The
kubelet:
  enabled: true
  namespace: kube-system

  serviceMonitor:
    ## Scrape interval. If not set, the Prometheus default scrape interval is used.
    ##
    interval: ""

    ## Enable scraping the kubelet over https. For requirements to enable this see
    ## https://github.com/coreos/prometheus-operator/issues/926
    ##
    https: false
And import the dashboard required to monitor your GPUs which you can find here: https://grafana.com/dashboards/8769/revisions and set it up as a configmap.
In most cases, you will want to monitor your cluster from outside and for that you will need to install / upgrade the prometheus-operator chart with the grafana.ingress.enabled value as true and grafana.ingress.hosts={domain.tld}
Next in line, you have to deploy your actual containers that use the GPU. As a rule, a container cannot use a part of a GPU but only the whole GPU so thread carefully when you’re deploying your cluster because you can only scale horizontally as of now.
When you’re defining the POD, add in the container spec the following snip below:
    resources:
      limits:
       nvidia.com/gpu: 1
End result would look like this deployment:
apiVersion: apps/v1beta1
kind: Deployment
metadata:
  name: tensorflow
spec:
  replicas: 2
  template:
    metadata:
      labels:
        app: tensorflow
    spec:
      containers:
      - name: tensorflow
        image: tensorflow/serving:latest
        imagePullPolicy: IfNotPresent
        resources:
         limits:
nvidia.com/gpu: 1In some rare cases, the Nvidia driver may blow up your data nodes. Yes that happened to me and needed to solved it.
The manifestation looks like this. The ingress controller works randomly, cluster resources show as evicted. The nvidia device restarts frequently and your GPU containers are stuck in pending.
The way to fix it is first by deleting the evicted / error status pods by running this command:
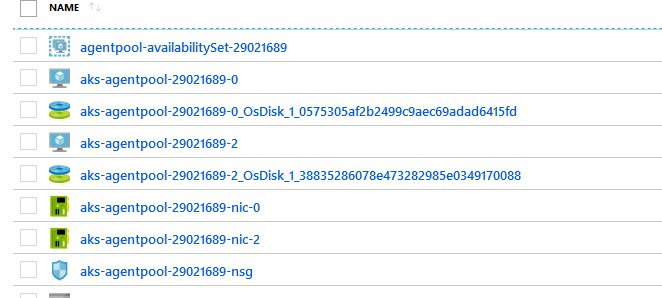
kubectl get pods --all-namespaces --field-selector 'status.phase==Failed' -o json | kubectl delete -f -And then restart all the data nodes from Azure. You can find them in the Resource Group called MC_<ClusterRG><ClusterName><Region>

That being said, it’s fun times to run AKS in production ?
Signing out.
