Monitoring your subscription(s) is something very important when it comes to the cloud. Whether you’re looking at the performance, health or cost of the subscription.
In today’s blog we will go through Azure Monitor which allows you to monitor everything that you have deployed in your Azure Subscription at an infrastructure level and even application level by using Application Insights.
Azure monitor can pull data from multiple sources, not only the Azure cloud. This data is then aggregated and can be queried using the Kusto query language which can be complicated at first but you get used to it. I highly recommend this Pluralsight course which can introduce you to Kusto – https://www.pluralsight.com/courses/kusto-query-language-kql-from-scratch –
What can Azure Monitor pull?
AAD tenant: Any data that’s generated in your Azure Active Directory tenant can be pulled into Azure Monitor.
Azure Resources: Data about the operation of an Azure resource.
Apps: This ties in with Application Insights which can pull data from any platform or programing language.
Guest OS: This type of data is generated by the monitoring agent that’s installed inside a VM. This is cloud-agnostic and can work in any cloud or on-premises
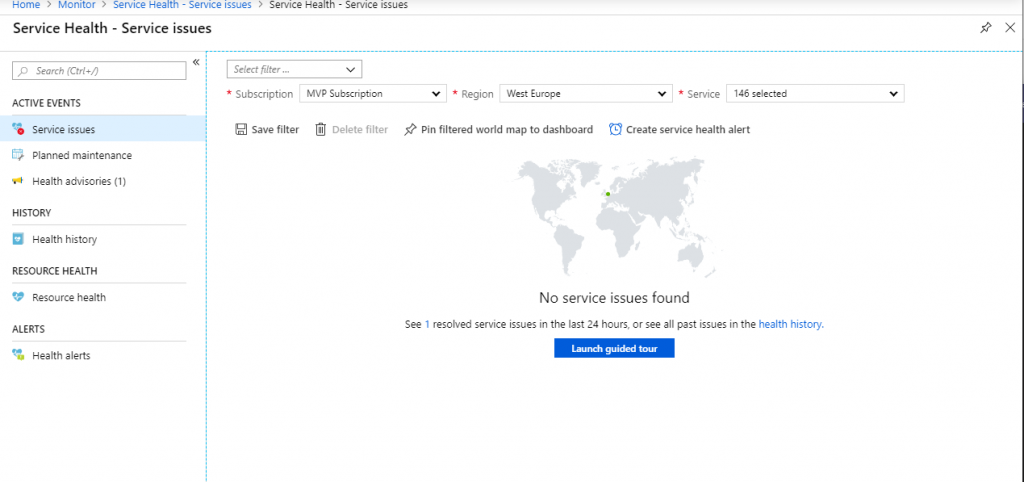
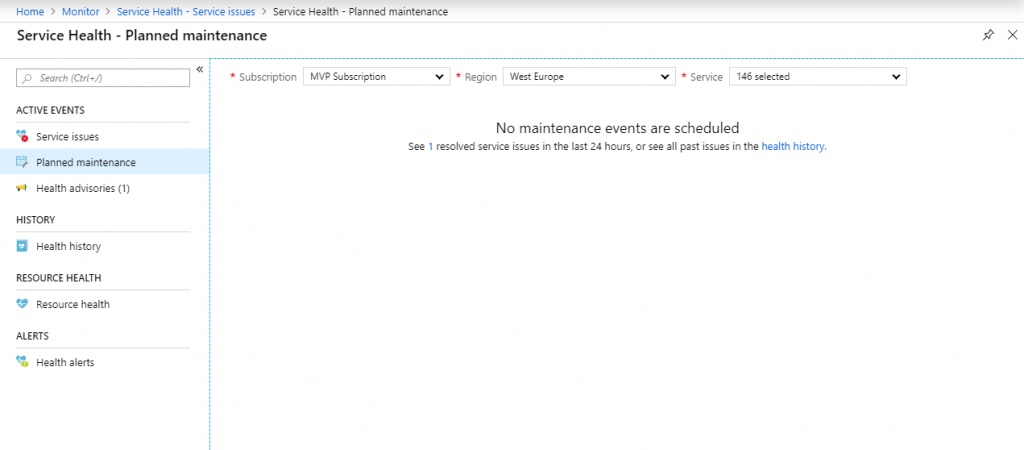
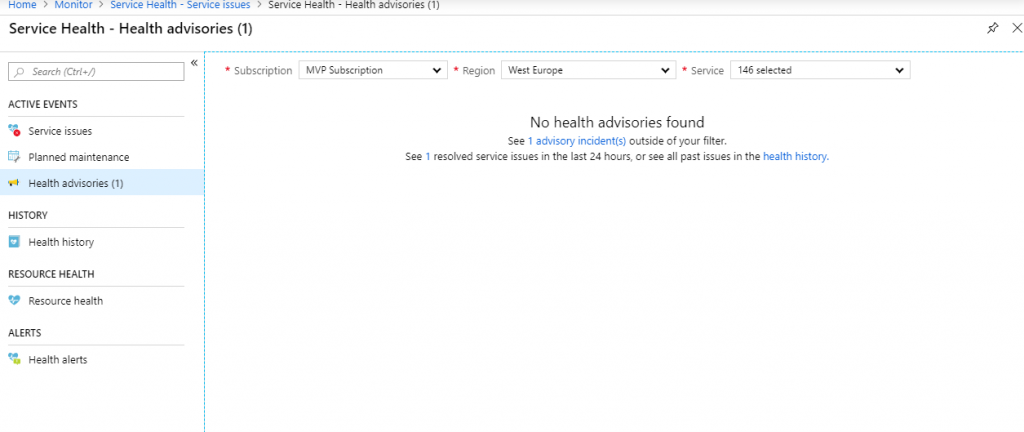
Subscription(s): Service Health Events, Planned Maintenance, etc.
Containers: AKS node, cluster, container events.
Security Events: Azure Security center <3
Data in Azure monitor is separated in two categories:
Metrics
Logs
Based on what you’re looking for, you can set up monitoring dashboards to check up performance metrics on your resources or you can set up other types of dashboards that query log data. For example I have a dashboard for monitoring my WordPress blog ?
In the screenshot from above, you can see that I have a dashboard set up to monitor sessions and unique users. (Hence the privacy pop up from the web site) But you don’t stop here; You need data points in a 30 day time-frame? You can build a dashboard like that without a problem. Your imagination is the limit.
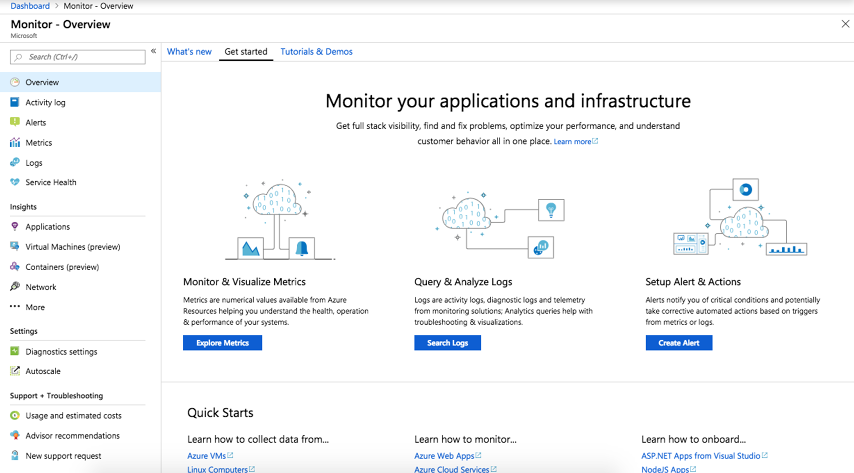
How can I query data?
You can query data by simply going to the Logs entry in the leftmost blade or by pressing on the Search Logs button in the Overview screen.
There you will be presented with a series of example queries which gives you a starting point and you also have a Query Explorer which gives you some useful general queries.
Those queries are populated from Log Analytics based on what imported solutions you have. If you don’t have anything then Log Management is the only one that will pop up.
That’s all with the overview. My next blog on Azure Monitor post will be more in-depth based on each solution.
Platform guardrails prevent damage but often turn into friction machines. How to design guardrails that actually prevent bad patterns, layer detection and correction, and build platforms developers trust.
APIM isn't just a gateway. It's a governance layer that enforces consistency across AKS, Container Apps, and other platforms. When to use it and when to keep things simple.
If you're still deploying to Azure from GitHub Actions with static credentials in 2026, you have better options. Here's how to eliminate credentials from GitHub entirely using OIDC and workload identity, and why it matters.


