I remember enabling Defender for Containers on a production cluster for the first time and thinking "alright, image scanning passed, Pod Security Standards are enforced, RBAC is in place, network policies deny what needs denying; we're golden." I had automated deployment controls that would make a security architect proud (on paper, at least), and I believed the hard part was behind me.
Then a container's process spawned a shell. A workload made an unexpected DNS lookup, and a binary that was never in the approved image showed up inside a running pod. On top of that, a week-old vulnerability disclosure hit a library baked into our image three months earlier, before the CVE even existed. Boy, that was a wake-up call.
My policies didn't break. The deployment gates I built worked exactly as designed, but none of that mattered since my security model ended at admission time, and everything after the pod was running was basically a black box. I had zero visibility into what the workloads were actually doing at runtime. This is the runtime security gap, and it's not theoretical. It's the distance between "this image was acceptable when we approved it" and "this workload is doing only what we expect it to do right now."
I had solved the supply-chain problem way faster than the runtime problem. Strong gates, good scanning, all of that, but visibility into running workloads is a different beast entirely since it requires observability into runtime behavior, not just cluster configuration. Defender for Containers fills exactly this gap.
Posture vs. Runtime: The Distinction That Matters
Before going further, this distinction matters because these aren't the same problem and they can't be solved by the same tools.
Security posture is what I can measure at rest: does the cluster have Network Policy support? Are Pod Security Standards enforced? Is RBAC configured? Did image scanning find vulnerabilities? I can build a checklist for all of this and answer these questions at deployment time or during a compliance scan.
Runtime behavior is what I can only see while things are running: what processes does a container spawn? What does it download? What network connections does it attempt? Does the active workload match the image I deployed? These are dynamic questions that require continuous observation, and no checklist is going to help here.
The thing is, posture controls are necessary but they're nowhere near sufficient. An attacker who compromises a pod doesn't care whether it was scanned before deployment. A vulnerability that emerges after your image was baked doesn't respect your admission controls, and malicious behavior happens in the running pod, not in the image artifact you stored in a registry. You can ace every compliance scan and still be completely blind to what's happening inside your workloads. That's the uncomfortable part.
Why Does Vulnerability Debt Keep Growing?
Build-time scanning is valuable, but vulnerabilities get disclosed after images are baked, and running containers don't purge themselves when a new CVE drops. Knowing you have vulnerability debt and being able to triage it are different things entirely.
The spreadsheet approach (image name, CVE ID, severity, pod count) is basically useless since it strips all context. What actually matters is whether the vulnerable package is actually present in the running container or was mitigated during build - this distinction alone eliminates a surprising number of false alarms. Beyond that, you need to know if the workload is externally exposed, what the actual attack surface looks like, whether the vulnerability requires a specific version of a dependent library that isn't present, and how difficult it is to patch and redeploy without breaking other workloads.
None of these are answerable by scanning a registry. They require connecting vulnerability data to runtime context, which is the thing that takes actual effort and thought. That connection is where Defender becomes valuable. It's not that Defender finds vulnerabilities registry scanning doesn't find, it's that Defender connects vulnerability data to runtime exposure and behavior, transforming a meaningless list into something you can actually act on.
How Defender for Containers Works
Defender operates across two modes of visibility, and understanding the distinction is pretty essential to using it effectively, so let's walk through them.
Agentless visibility comes from API-driven scanning. Defender connects to your container registry and scans images for vulnerabilities, malware, and misconfigurations, then examines the Kubernetes API to understand cluster configuration, pod specifications, and network policies. This requires no agent on your nodes and has minimal overhead, which is why I'd recommend starting here. Now, agentless visibility is broad but shallow. It can't see runtime behavior, so you get good coverage of what's deployed but zero insight into what those workloads are actually doing.
Sensor-based visibility comes from runtime agents deployed to your nodes (basically a DaemonSet that watches everything). These agents observe process execution, network activity, and file system access. They understand what binaries are running, what system calls are being made, what files are being written. This is where you get runtime behavior data, and also where you spend more infrastructure to collect, store, and process it. Narrower in scope but much deeper in detail.
My recommendation: start with agentless for breadth, deploy sensors where risk justifies the overhead, and don't assume you need sensors everywhere on day one. Agentless got me surprisingly far, and I added runtime depth later only where the risk profile demanded it.
What Defender Finds: Posture
When Defender scans your cluster configuration, it looks for patterns that increase risk: pods running as root without explicit denial (more common than you'd think even in production clusters), privileged containers in non-system namespaces, containers that allow privilege escalation, and network policies that are too permissive or just missing entirely.
It also catches workloads missing resource requests and limits, secrets stored in environment variables without encryption, missing network segmentation between namespaces, workloads running public container images without digest pinning, and service accounts with broad RBAC permissions.
Defender surfaces these without pretending they're all equally urgent, and that alone puts it ahead of a lot of scanning tools I've used :) A privileged development tool in your CI/CD namespace is different from a privileged workload in your product pod. So Defender lets you establish baselines and understand context rather than just counting findings. You can read more about how the recommendations work here.
Runtime Behavior Detection in Practice
When Defender deploys to your nodes, it observes process execution in running containers and builds a profile of what's "normal" for each workload, which means it can then surface deviations from that baseline.
Some deviations are legitimate: a backup workload that runs monthly and mounts host volumes shouldn't trigger an incident every month, and a scanning pod that reads the entire filesystem isn't suspicious. Other deviations are precisely what you want to know about immediately: a workload spawning a shell when it should never do so, a container attempting to download a tool after deployment, a database pod making DNS requests to external domains (always a red flag, no exceptions), a workload modifying files in a shared mount that should be read-only, or process execution from unexpected parent processes which often indicates lateral movement.
I initially underestimated how noisy binary drift detection would be. The concept is simple: a container executes a binary not present in the original image. Sounds clean, but the first week is chaos because this can happen through a workload with write access to its own filesystem that downloads a tool, a container with a package manager that installs something at runtime (yes, people still do this in production), an attacker who compromises the container and adds malicious binaries, or a sidecar or init container that modifies the filesystem.
Binary drift is a precursor to attack more than you'd think. An attacker who compromises a pod typically tries to install attack tools, and detection of unexpected binary execution before those tools can be used gives you a narrow window to respond, and I mean narrow. More broadly, binary drift indicates that the container isn't immutable, which defeats the entire purpose of containerization in the first place.
Vulnerability Management with Runtime Context
Defender changes the vulnerability conversation by adding runtime and exposure context, and that's where it actually earns its keep. Standard vulnerability scanning gives you a list of CVEs in an image. Defender layers on top of that:
First, reachability: is the vulnerable code actually reachable? Some vulnerabilities require specific configuration or input that your workload doesn't expose. If the vulnerable code path is unreachable (and a surprising number are), the risk is lower.
Then there's exposure. A vulnerable image running in an isolated pod with no ingress is a completely different story from the same vulnerability in a workload powering your public API. Defender knows which is which, and that context alone changes how you prioritize response.
Blast radius is the one that always stresses me out: if the vulnerable component is in a library your entire platform depends on (and let's be real, it usually is), patching one pod is useless. If it's isolated to one workload, response is simpler.
And finally, Defender can tell you whether the vulnerable code path is even being exercised at runtime, which is useful since a lot of the time it isn't.
This transforms vulnerability management from "we found 47 CVEs, prioritize them somehow" to "here are 3 CVEs that are actually reachable, externally exposed, and being actively used." The difference is enormous when it comes to operational prioritization. You can read more about how Defender does vulnerability assessment with runtime context here.
How Do You Keep Alert Fatigue from Killing the Signal?
Defender integrates with Microsoft Defender for Cloud, so alerts can create incidents, flow into your SOC workflows, or integrate with SIEM platforms like Microsoft Sentinel. But here's the thing: runtime security telemetry can generate enormous amounts of data, and if every anomaly becomes an alert, your team tunes everything out within a week. I've seen this happen more than once, and it's the number one reason Defender deployments get abandoned.
Effective deployment requires tuning from day one, and here's how I think about the tiers:
Tier
What Goes Here
Alert Behavior
Examples
High-confidence
Behaviors that are almost always malicious
Wake-me-up-at-3am alerts
Known malware hashes, shell spawning from non-shell processes, cryptomining signatures
Baseline deviation
Workloads deviating from established behavioral profile
Review-next-morning alerts
Unusual network patterns, unexpected process trees, atypical file access
Investigation telemetry
Everything else; retained and queryable
No real-time alerts, forensic use
Full process execution logs, DNS query history, connection metadata
This tiered approach lets you get the signal when it matters without drowning in noise. That being said, getting the tiers right takes iteration, so don't expect to nail it on the first try.
Practical Deployment
Alright, let's set it up. To enable Defender, you can create an AKS cluster with the flag or enable it on an existing cluster:
az aks create \
  --resource-group myResourceGroup \
  --name myCluster \
  --enable-defender
Verify the DaemonSet deployed to all nodes and then check findings in the portal:
kubectl get ds -n kube-system | grep -i defender
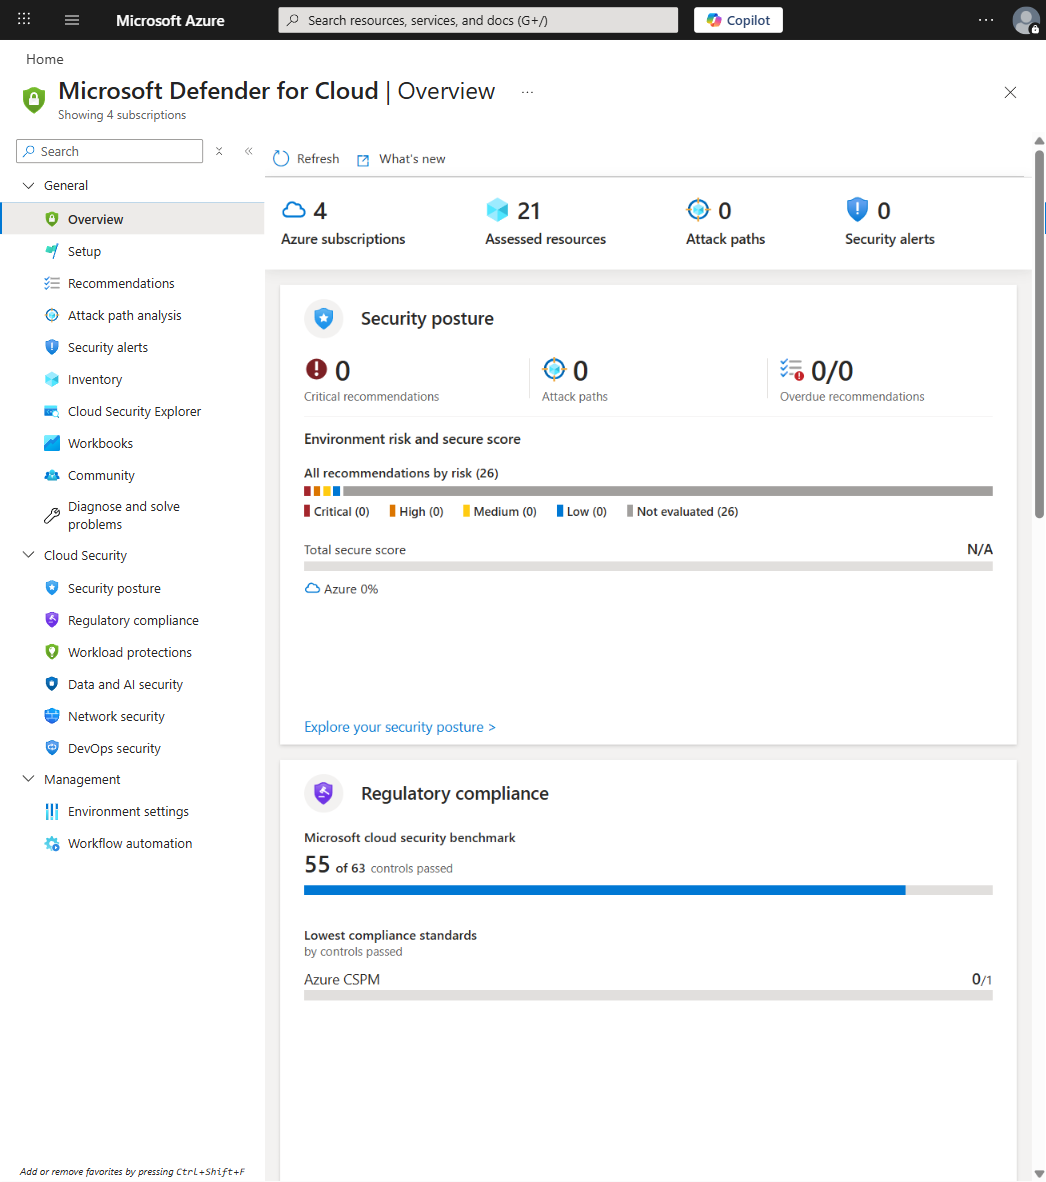
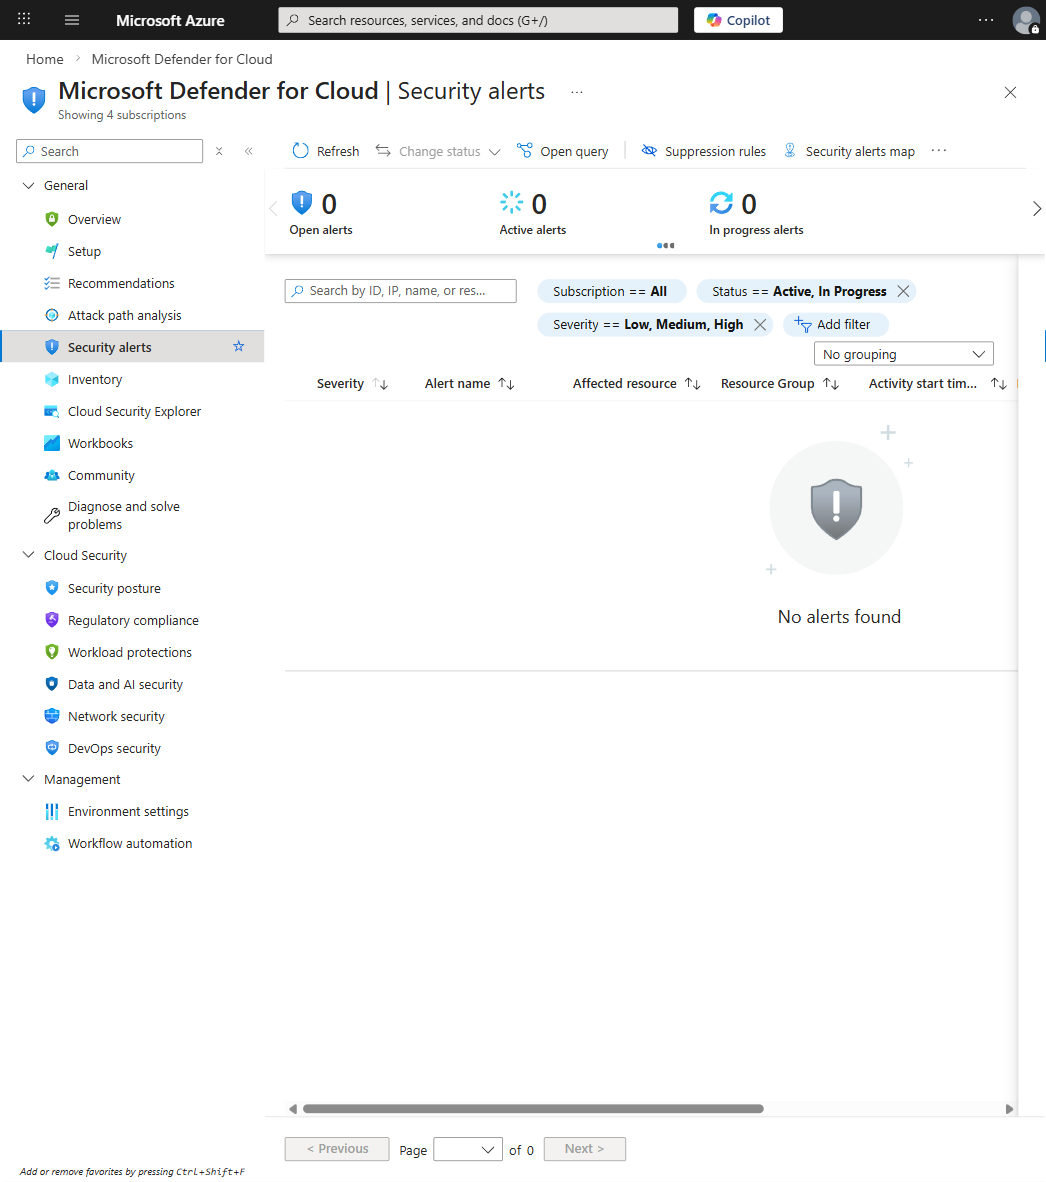
Navigate to Microsoft Defender for Cloud > Kubernetes Clusters; posture findings appear under Security Standards and runtime findings appear under Security Alerts. The full onboarding guide is here. You can also query findings directly in Log Analytics:
SecurityAlert
| where ResourceId contains "Microsoft.ContainerService/managedClusters"
| where AlertName contains "Runtime"
| project TimeGenerated, AlertName, CompromisedEntity, AlertSeverity
| order by TimeGenerated desc
Tuning in Practice
Raw Defender deployment produces too much signal, so here are the practical tuning approaches that I've found work well.
You don't need to deploy sensors to every cluster. The Defender sensor is a managed AKS addon, and you enable it at the cluster level, not the node level. This means you control coverage by choosing which clusters get runtime agents rather than labeling individual nodes. Deploy sensors to production and sensitive workload clusters, and use agentless scanning everywhere else. To enable the Defender sensor on an existing cluster:
az aks update \
  --resource-group myResourceGroup \
  --name myCluster \
  --enable-defender
After deployment, allow a baseline establishment period of 7-14 days. During this time, normal behavior is observed and profiled, and once the baseline is established, deviations become meaningful. Whatever you do, don't skip this waiting period. You'll just be chasing noise and getting frustrated for no reason.
Suppression rules let you exclude expected behaviors, but suppression should be targeted. If you find yourself suppressing entire alert categories, that's a sign your tuning is wrong, not that the tool is broken. You can configure alert suppression rules in Defender for Cloud. Beyond suppression, build custom Log Analytics queries that correlate Defender data with your operational context:
let riskPods = SecurityAlert
| where ResourceId contains "Microsoft.ContainerService/managedClusters"
| where AlertSeverity in ("High", "Medium")
| extend PodName = extractjson("$.PodName", tostring(ExtendedProperties))
| distinct PodName;
KubePodInventory
| where Name in (riskPods)
| project Name, Namespace, ClusterName, PodCreationTimeStamp, PodStatus
| order by PodCreationTimeStamp desc
This identifies pods with active alerts and gives you the operational context to start triaging (which cluster, which namespace, when it was created). You can build automation on top of this to prioritize response.
Common Mistakes
I've made a few of these myself, so save yourself the trouble.
The alert fatigue trap is real: deploying Defender and immediately alerting on every signal means your team ignores all alerts within a week. Start with high-confidence alerts only and build outward from there. I can't stress this enough because I've watched multiple teams go through the exact same cycle of enabling everything, getting overwhelmed, and then disabling Defender entirely. It's a predictable failure mode, and the fix is always the same - start narrow.
Then there's treating Defender as a replacement for admission control, which is a mistake. Defender complements admission control, it doesn't replace it. A pod that should be denied by policy should still be denied at admission time, and runtime detection is your second line of defense, not your first. Ignoring the baseline period falls into the same category of impatience - the false positives that drive teams crazy happen precisely since the baseline isn't established yet. Wait for the learning period to complete before evaluating signal quality. Patience here saves you a lot of pain later, I promise.
Deploying sensors without understanding cost will burn you, too. Runtime telemetry scales with pod count and behavioral complexity, so a cluster with thousands of pods will generate enormous telemetry volume. Before deploying sensors cluster-wide, you need to actually think about this: how many pods? What's the telemetry traffic? Do you have Log Analytics workspace capacity? What's the cost implication? I've seen teams get surprised by a 40% jump in monitoring costs, and you really don't want to be that team.
And finally, treating vulnerability lists as prioritization doesn't work. A cluster with 47 vulnerabilities isn't necessarily worse than one with 3, not if the 47 are in isolated test pods and the 3 are in critical production workloads. Use Defender's context-aware prioritization, not raw counts.
Integration Patterns
In CI/CD: Build and push images to ACR where Defender for Containers automatically scans them. You can use az acr build for cloud-side builds that trigger vulnerability assessment on push:
With Policy Enforcement: Use Azure Policy for Kubernetes to enforce cluster configurations that complement Defender findings:
Note: Azure Policy for Kubernetes uses the Microsoft.Kubernetes.Data resource provider mode, but enforcement is implemented via Gatekeeper constraint templates (Rego), not direct field path references. Rather than authoring custom Rego, prefer the built-in policy "Kubernetes cluster should not allow privileged containers" (policy definition ID: 95edb821-ddaf-4404-9732-666045e056b4). Assign it via the Azure portal (Policy > Definitions > search "privileged containers") or the az policy assignment create command with that definition ID.
With Incident Response: Defender findings can automatically create incidents in Microsoft Sentinel. Set this up through the Azure portal: Microsoft Sentinel > Data connectors > Microsoft Defender for Cloud > Connect. The portal handles the underlying ARM configuration for the data connector, which is more reliable than the CLI for this specific connector type. See the Sentinel + Defender for Cloud integration docs for details.
The Right Level of Investment
Not every cluster needs identical Defender configuration, and risk should drive depth. Here's how I think about the maturity levels:
Level
Strategy
What You Get
When to Use
Cost
Level 1
Agentless Compliance
Registry scanning, cluster config auditing, vulnerability detection without runtime visibility
Low-risk internal tools, dev/test clusters
Minimal
Level 2
Selective Runtime Monitoring
Runtime agents on high-risk clusters, full posture + runtime visibility where threat profiles justify the overhead
Production workloads, anything customer-facing
Medium
Level 3
Full Fleet Instrumentation
All clusters get both agentless scanning and runtime agents, custom alerts and playbooks integrate with SOC workflows
Regulated industries, high-value targets
High
If you're building a serious AKS platform, target Level 2. Deploy sensors to production and sensitive workload clusters, use agentless scanning everywhere, and the cost-benefit ratio will favor this approach.
I for one have been running Level 2 across my clusters and it hits the sweet spot: runtime visibility where it matters, posture scanning everywhere, and a cost profile that won't make your finance team lose sleep. Just don't let the perfect security model stop you from shipping the good-enough one. Level 2 is a reasonable place to start and you can always expand from there.
Node image retirement is not an emergency if you treat it as a predictable operating model. How to migrate images without chaos, what to test, and how to govern the decision.
APIM isn't just a gateway. It's a governance layer that enforces consistency across AKS, Container Apps, and other platforms. When to use it and when to keep things simple.
Network policy is not theoretical; Cilium and eBPF make it practical. Learn when segmentation actually matters, how to observe before you enforce, and why most teams get it wrong at first.


